Documentary synthesis prepared with AI assistance. It does not replace specialist review or certify kitchen testing. · Updated 3 November 2026
A country of many foodways
South African cooking is not one fixed collection of national dishes. It includes foodways shaped by Indigenous communities, European settlement, migration from Asia and the histories of particular towns and regions. The documented repertoire ranges from maize-based pap and meat cooked over coals to Durban curries, Cape Malay preparations and sweet baked or fried pastries. These dishes belong to different histories; placing them together on a national map should not make their origins interchangeable.
Place matters. Durban, on the eastern coast in KwaZulu-Natal, is closely associated with a distinctive Indian South African cuisine and with bunny chow. Cape Town and the wider Cape connect to Cape Malay heritage as well as Afrikaans-speaking baking traditions. The Karoo appears in the documented name karoowors, a regional boerewors variety. These are useful routes into the country’s culinary diversity, not a complete account of every province or community.
A reader might meet several traditions in a single meal or public gathering, but that does not erase their differences. Boerewors at a braai, a Durban curry served in a loaf, and a milk tart dusted with cinnamon each point to different ingredients, techniques and cultural associations. The atlas treats them as connected parts of a varied food culture, not as interchangeable symbols.
Migration, adaptation and exchange
South African food history includes both the movement of people and the adjustments made under unequal conditions. In KwaZulu-Natal, Indian indentured labourers arrived at the port of Natal between 1860 and 1911 and worked in sectors including sugar plantations, railways and fishing. Food rations are documented as including split peas, dried fish, oil and rice. When rice was scarce, some cooks crushed dried maize into a substitute called mealie rice. These details describe a particular history of labour and adaptation, not a uniform experience for all Indian South Africans.
Durban Indian cooking developed through contact between people from different parts of India and the ingredients available locally. Accounts of the cuisine describe the incorporation of local foods and changing versions of spices and cooking styles. Gujarati traders also supplied spices and other goods, while local ingredients used by Zulu neighbours entered some cooks’ repertoires. The resulting cuisine is often described as hybrid and continually evolving; it should not be reduced to a transplanted version of one regional Indian cuisine.
Cape Malay food is another distinct South African tradition, associated with a community and history that should not be collapsed into a generic label for Asian influence. In the Cape, milk tart is also linked in the evidence to Dutch colonial-era cooking. Historical accounts of individual foods can differ, so a dish’s broad cultural connection is more dependable than an unsupported claim of one exclusive origin.
Maize, meat, spices and local ingredients
Maize appears in South African food in more than one form. Pap is a maize-meal porridge commonly served with boerewors, while Durban food accounts describe crushed dried maize used as mealie rice when rice was scarce. They also record fermented maize-meal sour porridge among some labourers’ foods. These preparations show how a staple can be transformed to suit different circumstances; they are not simply variants of the same dish.
Durban’s documented pantry includes split peas, rice, dried fish and oil in the ration history, alongside ingredients used in later cooking: local chickens, madumbi, amasi, green mangoes, bananas and fish. Fresh curry leaves, spices and masala are important in descriptions of Durban curry. These ingredients belong to a particular regional culinary history, rather than defining all South African food.
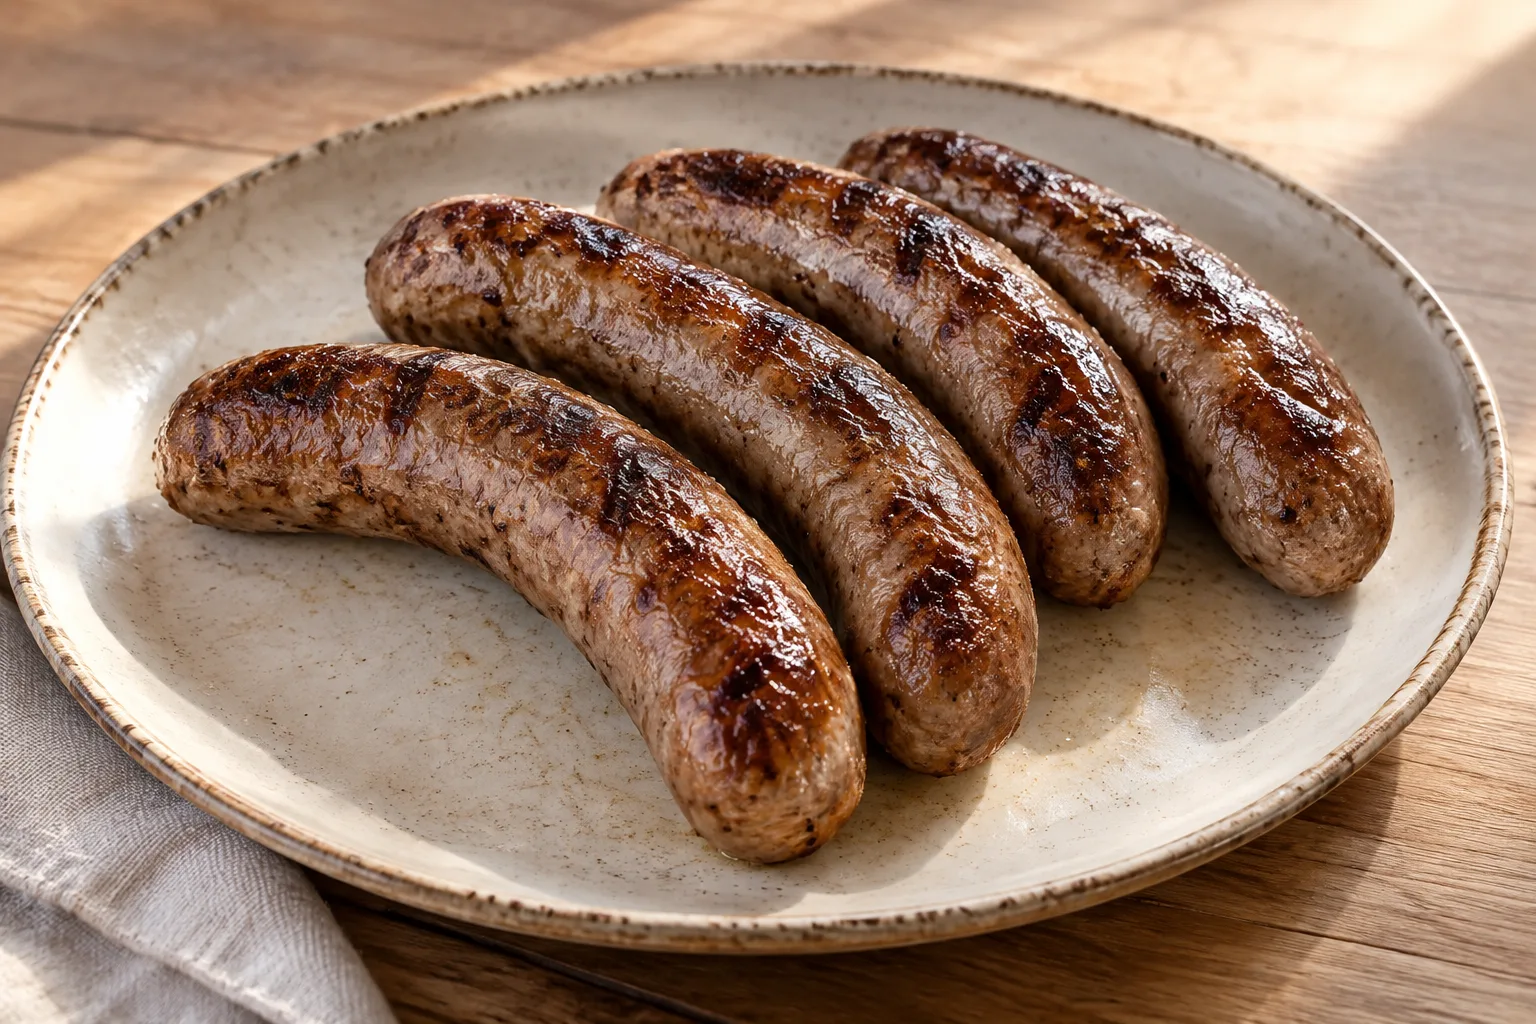
Meat takes many forms in the wider repertoire. Boerewors is a coarsely textured sausage associated with beef and spices such as coriander, black pepper, cloves and nutmeg; some versions also use pork or lamb. The regional name karoowors is documented as one variety. Other familiar ingredients link to specific preparations: milk and eggs in melktert, wheat flour in vetkoek and koeksisters, and bread as the container for bunny chow. Recognising these differences makes the pantry a map of dishes and communities rather than a single national shopping list.
Warm spice, smoke and contrasting textures
Durban curries are described as aromatic, often hot, and distinct in their use of fresh masala and curry leaves. Cooks pay attention to how onions and garlic are prepared, and some curries develop a visible sheen of oil. Potatoes can soften in the sauce and help give it body. Heat levels and recipes vary, so “Durban curry” is not a single standardized seasoning formula. A bunny chow may carry that curry in bread, bringing together the savoury, spiced filling and a soft, absorbent interior.
Boerewors offers a different flavour structure: the savoury richness of coarsely ground meat alongside coriander and other spices. Its texture is part of its identity, as is the contrast between browned sausage and the smoky character of a braai. The exact seasoning can vary; regional names and individual recipes do not establish one universal blend.
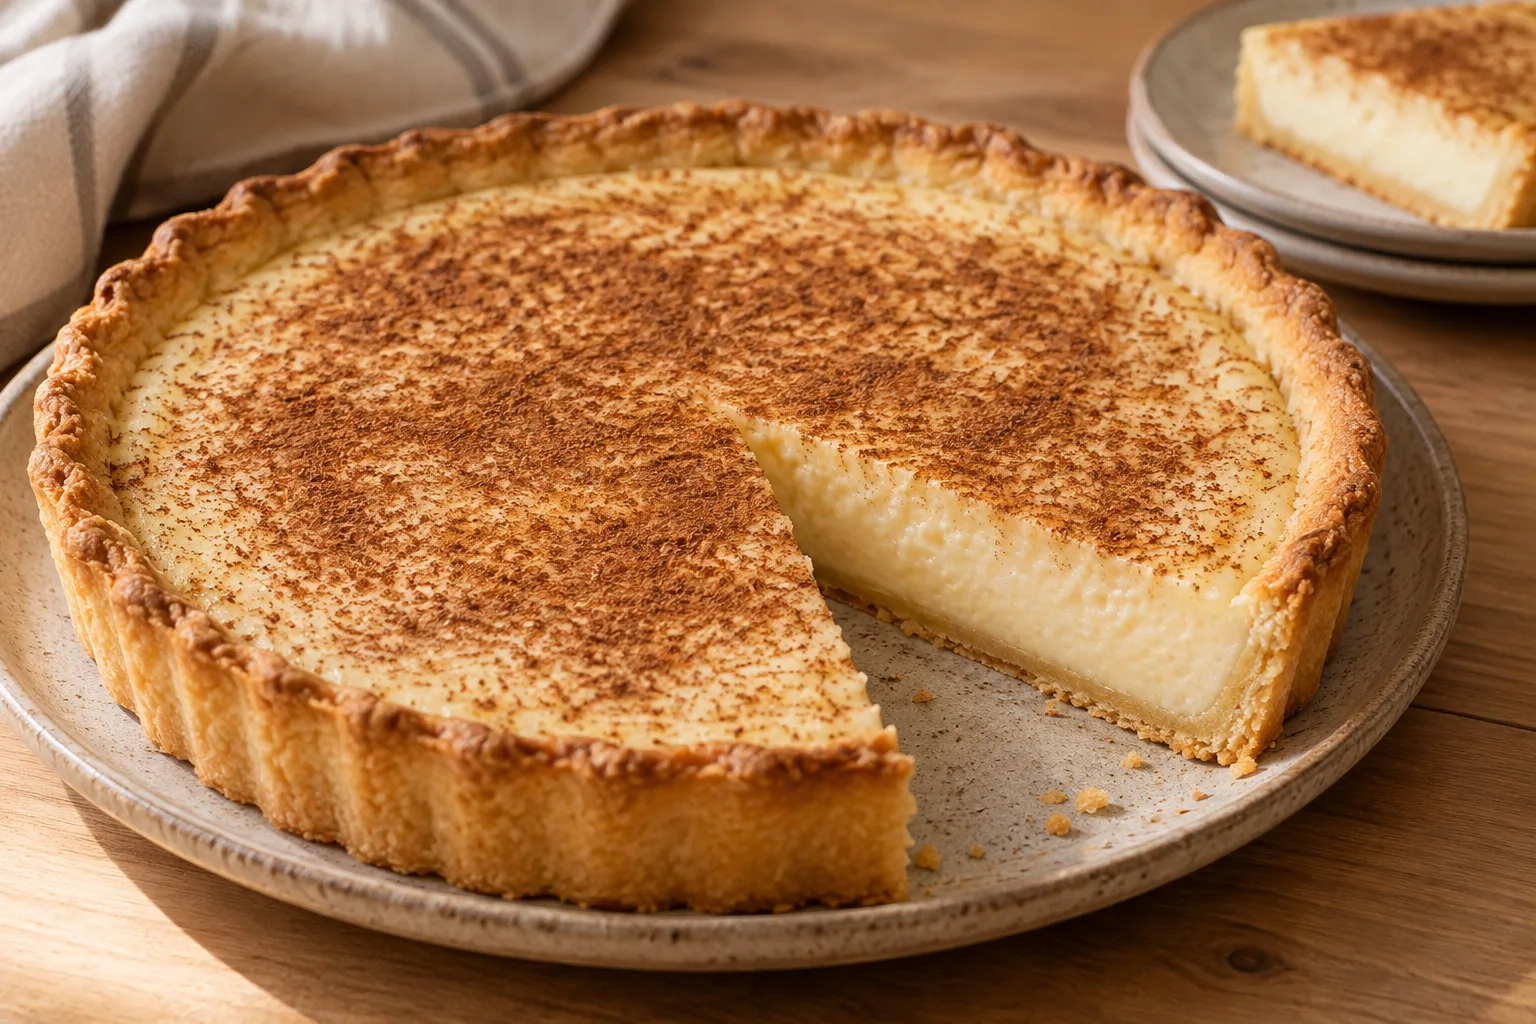
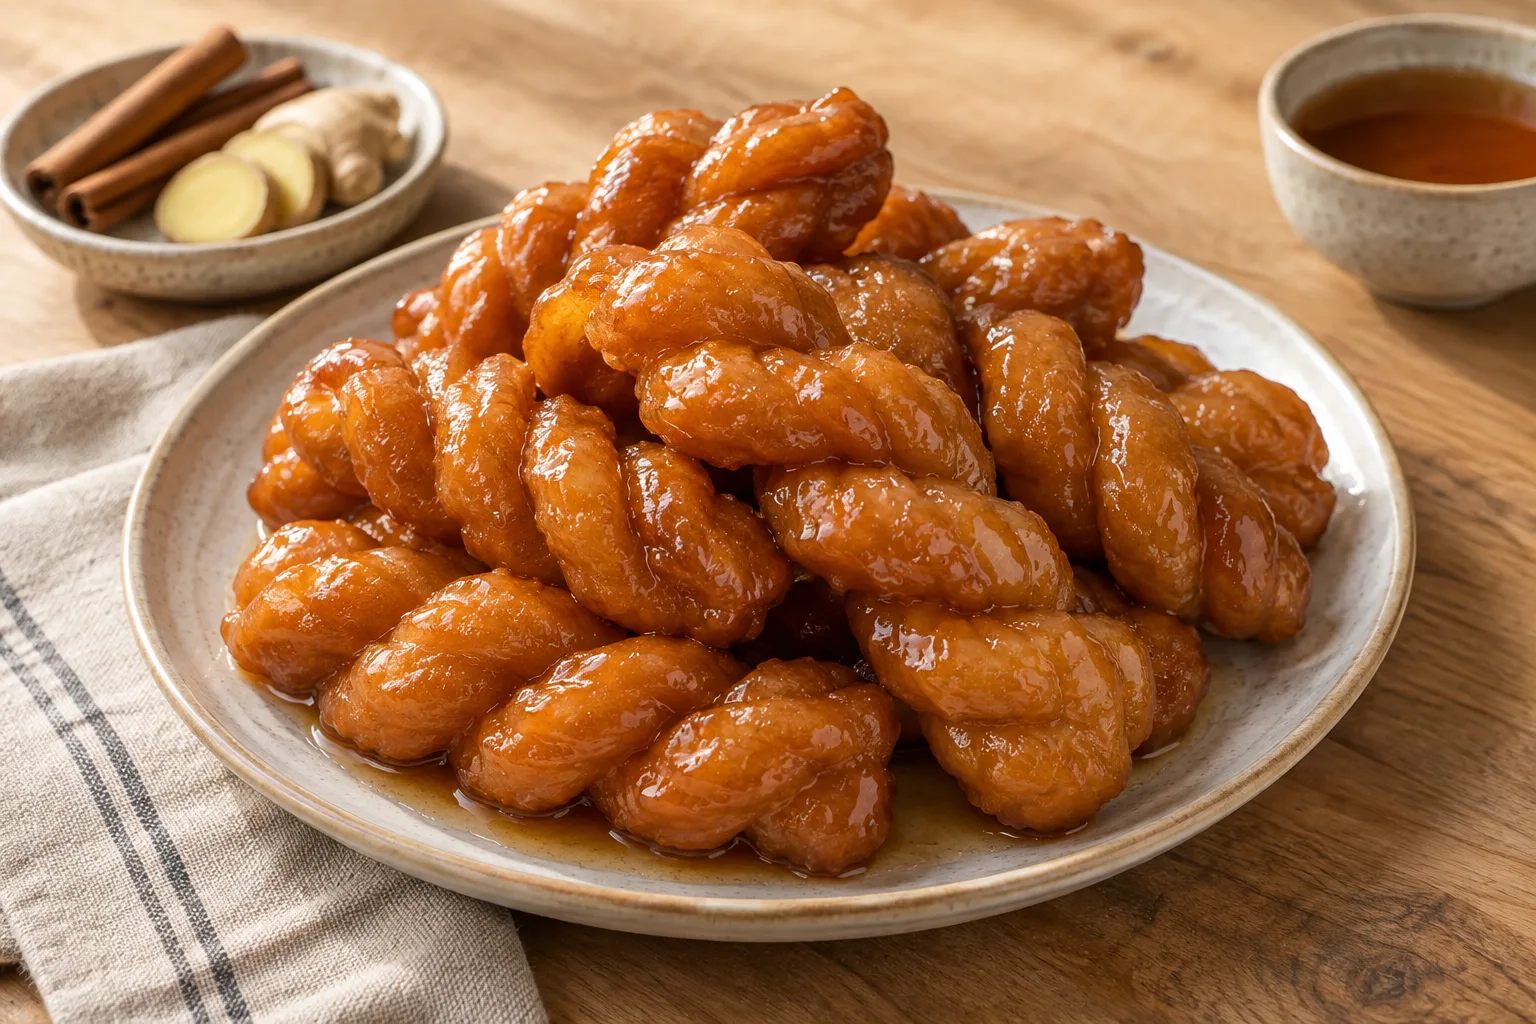
Sweet foods show another set of contrasts. The braided Afrikaner-style koeksister is described as crisp and syrup-soaked, while the Cape Malay-associated koesister is described in some accounts as softer, more cake-like, spiced and coated with coconut. Melktert, by comparison, pairs a tender pastry base with a creamy milk filling and a familiar dusting of cinnamon. Texture is as meaningful as flavour: crisp against syrup, bread against curry, and pastry against custard all help distinguish these preparations.
Gathering, celebration and transmission
The braai is a prominent way of bringing food and people together in accounts of South African eating. Boerewors may be grilled for family gatherings, public holidays and sporting occasions; it also appears in boerewors rolls sold at school fêtes and events. A shared fire can accommodate foods connected to different communities, but the gathering does not make every dish part of the same culinary tradition. Stories about Heritage Day describe the braai as one way people are invited to share heritage; that association should not be taken as proof that everyone celebrates in the same way.
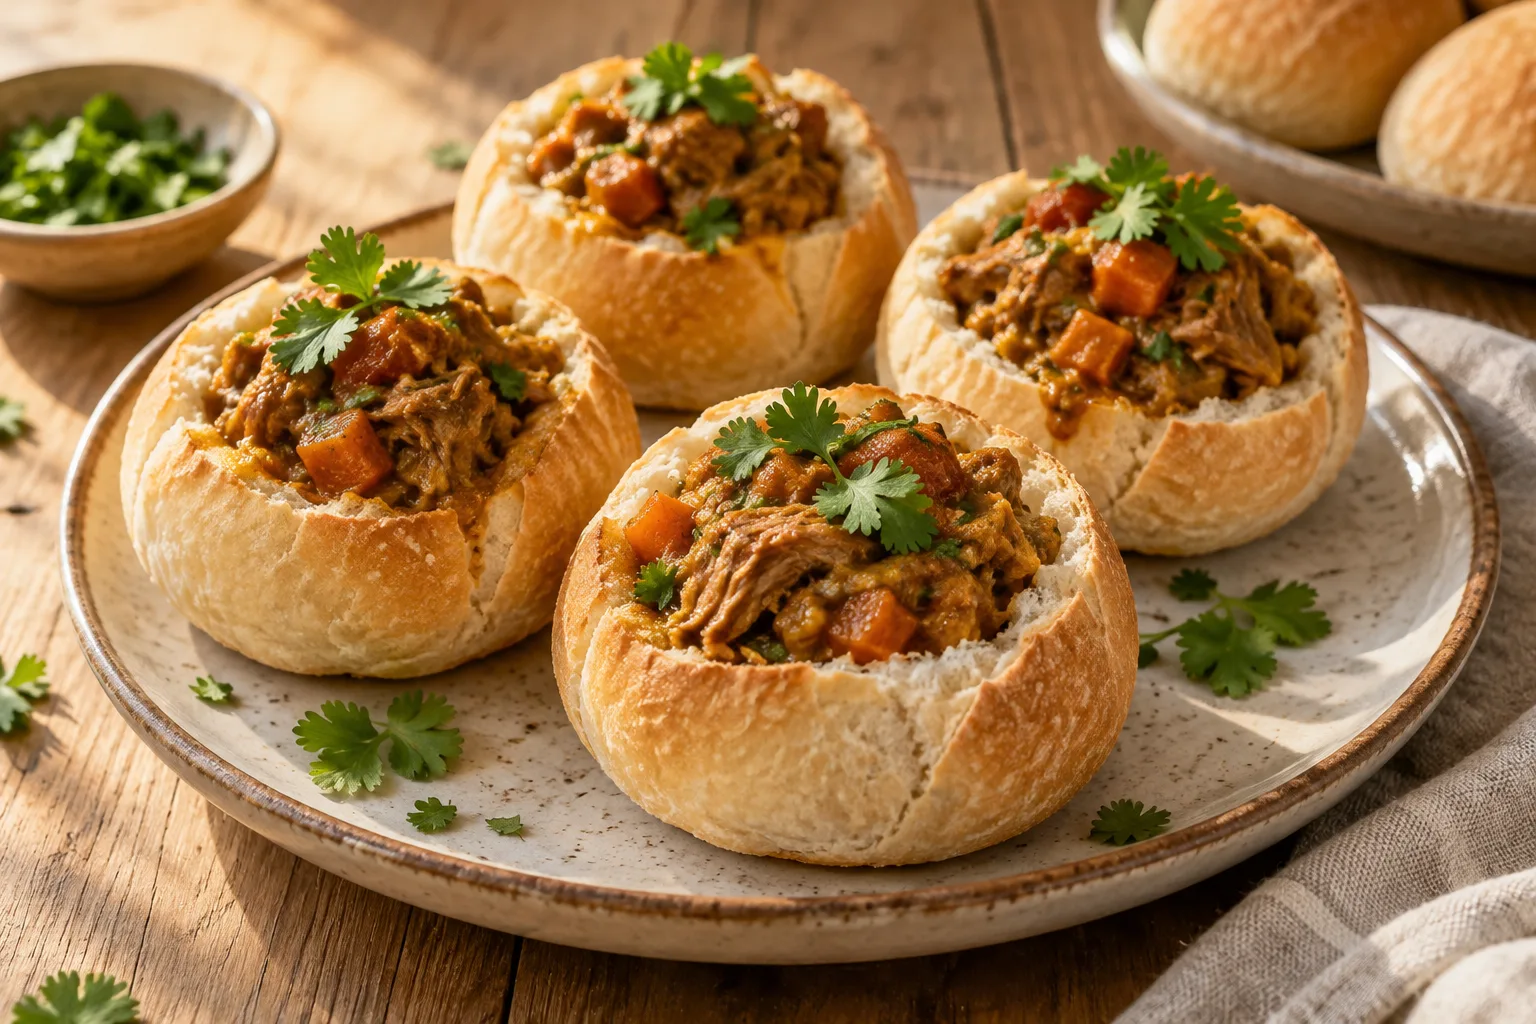
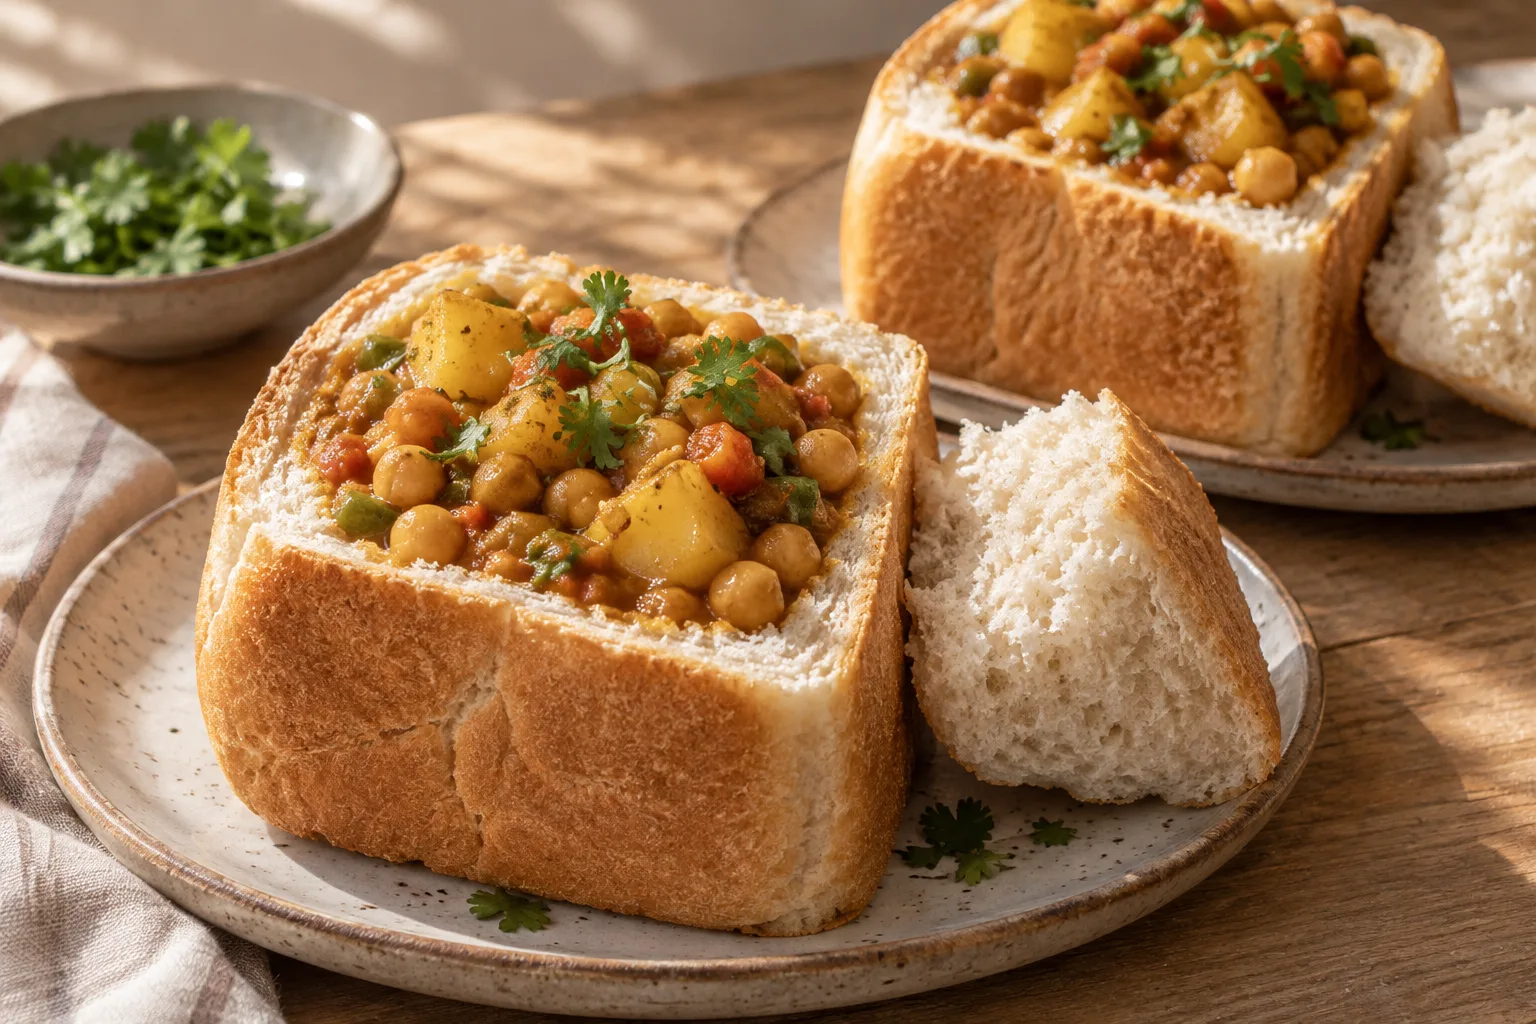
Durban curry and bunny chow have a more specifically urban history. Bunny chow is a loaf or portion of white bread hollowed out and filled with curry. The dish is associated with Durban’s Indian community and with a past shaped by labour, migration and segregation. Accounts differ on the precise origin story, so it is safer to describe the established connection to Durban than to present one disputed anecdote as settled fact.
Recipes and tastes also travel through household cooking and informal sharing. Koeksisters and koesisters illustrate how a shared name can cover distinct preparations associated with different communities. Sweet pastries may be served with tea or coffee, while vetkoek appears in accounts of markets, school events and roadside stalls. These settings are documented examples, not a complete schedule of how South Africans eat or celebrate.
Grilling, frying, simmering and shaping
Cooking methods help identify a dish as clearly as its ingredients. For a braai, boerewors is grilled over coals; it can also be cooked by other means, but grilling connects it to a particular social setting. The sausage is commonly formed as a continuous coil. Its coarse grind and casing create a different result from a finely textured link. Accounts of sausage-making describe seasoning the meat and filling casings, while cooking guidance stresses gentle handling to retain the sausage’s shape and juices.
Bunny chow depends on the construction of its bread container. A portion of loaf is cut so that a base remains, the soft centre is removed, and curry is spooned into the hollow. The removed bread can be served alongside or used to scoop up the filling. That simple assembly changes how the curry is carried and eaten; it is not merely a curry accompanied by bread.
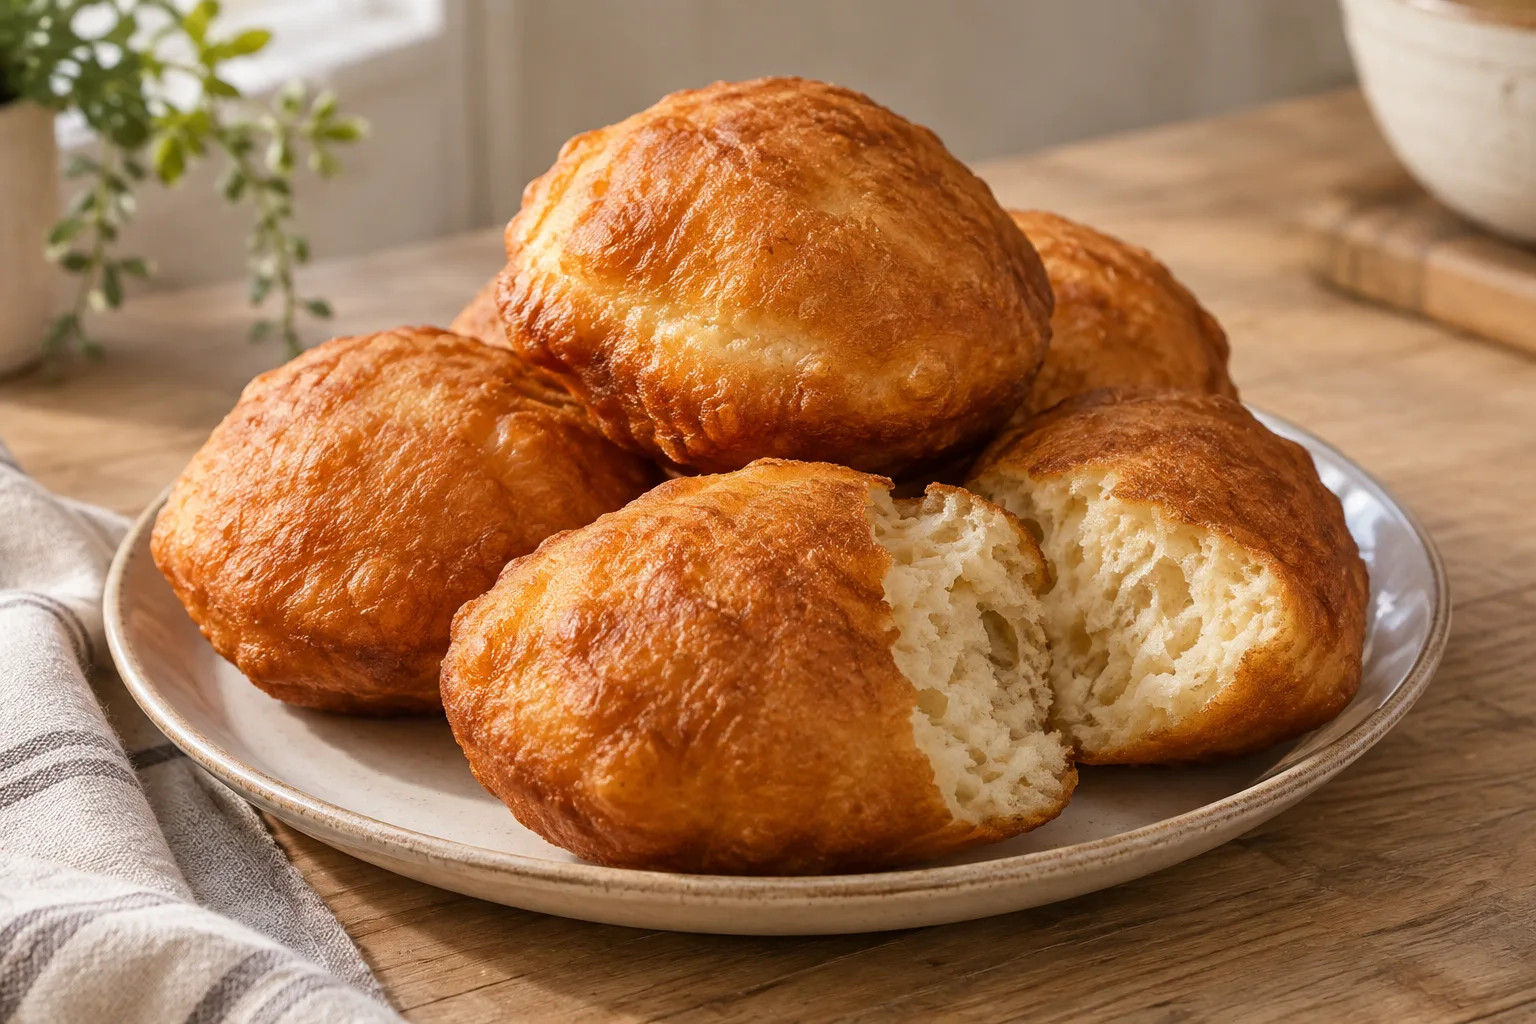
Fried dough appears in both savoury and sweet forms. Vetkoek is made from dough fried until the outside is golden and the centre remains soft; it may be filled or served with sweet accompaniments. Koeksisters are shaped into braids, fried, then dipped in syrup. One documented method relies on the contrast between hot pastry and well-chilled syrup, while melktert instead uses a baked pastry shell and a milk-based filling. These different transformations—grilling, hollowing, frying, syruping and setting custard—produce distinct textures and ways of serving.
How dishes are served and shared
South African meals may be organised around a fire, a filled loaf, a shared snack or a plated dessert. At a braai, boerewors can be served in a roll, and accounts describe it alongside pap or other grilled foods. The format is flexible, but the sausage’s place at the fire makes it both a dish and part of a gathering. References to school fêtes, sporting events and public celebrations show that it is also eaten beyond the household.
Bunny chow is designed to be portable and self-contained. A diner can break pieces from the bread wall to scoop up the curry, then eat the sauce-soaked base. It has been described as informal food, though versions also appear in seated restaurant settings. Its form makes bread, curry and serving vessel one edible whole. Fillings vary, including meat and vegetarian options; a particular filling should not be treated as the definition of the dish.
Sweet preparations occupy other moments at the table. Koeksisters are associated in accounts with tea or coffee and with family gatherings, while melktert is served as a sliceable tart after it has cooled and set. Vetkoek may be eaten with savoury filling or sweet accompaniments. Together, these examples show why a national table cannot be reduced to one meal pattern: a quick curry lunch, a braai and a sweet pastry with a hot drink have distinct forms and settings.
A glossary of South African preparations
These terms name particular foods or food forms. Some are connected to a region or community; none should be used as shorthand for the entire country’s cuisine.
- Bunny chow: A loaf or portion of white bread hollowed out and filled with curry. Associated with Durban’s Indian community, it can be made with different curry fillings, including vegetarian versions.
- Boerewors: A coarsely textured South African sausage, commonly seasoned with coriander and other spices and often cooked over a braai. The name is Afrikaans, combining boer (farmer) and wors (sausage).
- Braai: A method and social occasion centred on grilling food over coals. Boerewors is one of the foods commonly associated with it.
- Cape Malay koesister: A sweet fried-dough preparation distinguished in some accounts from the braided, crisp Afrikaner koeksister; the Cape Malay-associated version is described as softer, spiced and sometimes rolled in coconut.
- Melktert: Literally “milk tart,” a pastry with a milk-based, custard-like filling, commonly finished with cinnamon.
- Pap: A maize-meal porridge served as an accompaniment, including with boerewors.
- Vetkoek: Fried bread made from dough, eaten with savoury fillings or sweet accompaniments.
Spelling and usage can vary, particularly between koeksister, koeksuster and koesister. The names are related, but the preparations they refer to are not always identical.
One country, many cuisines
Cape Town and Cape Malay foodways
Cape Malay food is associated with a South African community and its own history, not a generic category for Asian cooking. Accounts of South African sweets also distinguish a softer, spiced Cape Malay-associated koesister from the crisp braided koeksister often linked with Afrikaner baking. Cape Town provides one documented route into these traditions, but they do not represent every cuisine of the Cape.
Durban and KwaZulu-Natal
Durban’s Indian cuisine developed through the history of Indian indentured labour and later exchange with local ingredients and traders. Its documented dishes include curries and bunny chow, a hollowed loaf filled with curry. Fresh curry leaves, masala and locally available foods are among the elements described in accounts of the city’s cooking; styles and heat levels vary rather than following one fixed recipe.
The Karoo
The Karoo is represented in the evidence through karoowors, a named regional variety of boerewors. Boerewors more broadly is a coarsely textured sausage seasoned with spices including coriander, and is often grilled at a braai. This documented regional name offers a specific connection to the Karoo; it does not establish that all South African sausage or meat comes from this region.
Cook
Timing and company
Meals per day. 89% had eaten supper on the recalled day.
983 African participants aged 15–64 living in the Cape Peninsula. Regional BRISK sample; observation in 1990. Cross-sectional study using a 24-hour dietary recall. Partial coverage of supper, without daily meal or snack counts or breakfast and lunch proportions. It represents neither the whole country nor current habits.
Daily energy distribution. In this regional sample, supper contributed more energy than any other meal.
Qualitative comparison of intake by meal in 1990. Partial coverage: no verified energy percentages by meal. Contributing more than other meals does not imply exceeding half of daily energy; this is not a national estimate.
Cooking frequency. Those who prepared food and drink spent an average of 99 minutes on it during the diary day.
People aged 10 or older who performed this activity in the national time-use survey. Domestic preparation of food and drink; October–December 2010. Retrospective 24-hour diary in 30-minute slots, weighted and with time divided between simultaneous activities. Partial coverage: mean among activity participants, not the whole population. It does not measure cooking days per week or minutes per meal; allocated time is not continuous elapsed time.
Eating at home and away. For school lunch, 73% ate school-provided food, 20% bought food from the school tuck-shop and 7% brought lunch boxes.
378 adolescents at four large high schools in rural Fetakgomo, Limpopo. Source of lunch at school; observation in 2017. Cross-sectional questionnaire on dietary practices and food frequency in the previous week; schools selected by enrolment and pupils by grade. Partial coverage of the school setting, without home/away shares for all meals. Food origin does not determine eating location; bringing a lunch box does not mean eating at home. Regional, not national, sample.
Eating together. Eating the main meal with family was a common practice in this urban adolescent cohort.
Company at the main meal; qualitative description from the study published in 2012. Partial coverage of one urban cohort, without percentages here or a breakdown by breakfast, lunch, supper or eating alone. Publication year is not presented as observation year.
Weekdays and weekends. 35.91% reported that their eating patterns differed at weekends.
323 Black adults aged 20–30 from central Tshwane suburbs; convenience sample. Self-reported weekday/weekend comparison; October 2012–January 2013. Self-administered questionnaire with open questions on differences at each meal. Partial coverage of a voluntary urban sample, not national. Includes composition and amount changes; it does not measure a timing delay or extra minutes per meal. Described differences do not necessarily apply to all participants.
Pantry and recipes
Most consumed ingredients. Agricultural per-capita series: maize 73.76, wheat 46.89, vegetables excluding potatoes 40.27 and potatoes 33.55 kg/person/year.
South African population as the per-capita reference for national agricultural series. Selected categories from the 2024 agricultural table, published in the 2026 edition. Official statistical compilation of agricultural consumption per capita; used as a supply indicator, not an individual intake survey. Partial coverage: not a ranking of all foods. The table consulted does not detail all weight bases or loss adjustments here; do not convert to cooked portions or intake. The 2024 row is used, without the preliminary marker attached to 2025.
Ingredient prevalence in recipes. In this Afrikaans recipe corpus, salt, egg, oil, pepper and butter are among the most frequent ingredients.
6863 recipes from Maroela Media, RSG, Afrikaans.com and Boerekos.com, aimed at Afrikaans-speaking audiences; 196 identified ingredients. Qualitative finding from the study published in 2022; exact collection dates are not specified in the methods consulted. Computer extraction from recipe text, excluding titles, using an ingredient list built after initially reading recipes in the corpus. Presence is studied, without amounts or instructions. Partial linguistic coverage, without representing all South Africa or implying dietary intake. The methods consulted do not detail cross-site deduplication. The qualitative order is retained; no percentages are presented without a verified collection date.
Cereals and plant foods
Cereals and cereal products. In 2024, the agricultural per-capita series records 73.76 kg of maize, 46.89 kg of wheat, 1.23 kg of grain sorghum and 4.23 kg of barley per person per year.
South Africa’s population; national per-capita statistic. Four cereal categories in the national table; annual quantities, with no aggregation across categories. Official agricultural compilation, per-capita consumption table; the 2024 row is retained rather than the provisional 2025 row. Partial coverage: no rice, pasta or oat quantity is supplied here. This is an agricultural supply indicator, not measured individual intake. The table does not specify all weight bases or loss adjustments; no conversion to cooked weight or servings.
Bread. For 2023/24, the national bread market indicator is 35 units per person per year. Production includes white, brown and whole-wheat bread.
Observation period: 2023/24. South Africa’s population; national per-capita statistic. Market series associated with pan-baked bread; the cited industry period runs from October 2023 to September 2024. Market compilation based on mandatory registration and monthly industry returns for grain and wheaten products. Partial coverage: bread units, with no uniform loaf mass or conversion to kg, slices or individual intake. Ingredients by type and provincial breakdowns are not supplied. The daily figure without an observation period is not used.
Pulses. In 2024, the agricultural per-capita series records 1.23 kg of dry beans per person per year.
South Africa’s population; national per-capita statistic. The “dry beans” category; dry product, with no conversion to cooked pulses. Official agricultural compilation, per-capita consumption table; the 2024 row is retained rather than the provisional 2025 row. Partial coverage: lentils, chickpeas and other pulses are not quantified. This is an agricultural supply indicator, not measured individual intake. The table does not specify all weight bases or loss adjustments; no conversion to cooked weight or servings.
Vegetables. In 2024, the agricultural per-capita series records 40.27 kg of vegetables, excluding potatoes, per person per year.
South Africa’s population; national per-capita statistic. National aggregate for vegetables; potatoes are counted separately. Official agricultural compilation, per-capita consumption table; the 2024 row is retained rather than the provisional 2025 row. Partial coverage: no ranking of vegetables or eating frequency. This is an agricultural supply indicator, not measured individual intake. The table does not specify all weight bases or loss adjustments; no conversion to cooked weight or servings.
Fruit. In 2024, the agricultural per-capita series records 24.01 kg of deciduous and subtropical fruit and 18.03 kg of citrus per person per year.
South Africa’s population; national per-capita statistic. Two fruit aggregates published separately; no new total is calculated. Official agricultural compilation, per-capita consumption table; the 2024 row is retained rather than the provisional 2025 row. Partial coverage: no species breakdown or ranking of individual fruits. This is an agricultural supply indicator, not measured individual intake. The table does not specify all weight bases or loss adjustments; no conversion to cooked weight or servings.
Potatoes, roots and tubers. In 2024, the agricultural per-capita series records 33.55 kg of potatoes per person per year.
South Africa’s population; national per-capita statistic. National potato category; not added to the vegetable figure that excludes potatoes. Official agricultural compilation, per-capita consumption table; the 2024 row is retained rather than the provisional 2025 row. Partial coverage: cassava, sweet potatoes and other roots are not quantified. This is an agricultural supply indicator, not measured individual intake. The table does not specify all weight bases or loss adjustments; no conversion to cooked weight or servings.
Protein foods
Meat. For 2024/25, the agricultural series records net human consumption of 35.30 kg of white meat and 25.52 kg of red meat per person per year.
South Africa’s population; national per-capita statistic. Two national meat aggregates, without a new total or allocation by species. Official agricultural compilation of per-capita consumption for 2024/25; distinguished from total production. Partial coverage: no separate chicken, pork and beef quantities here; the table does not specify carcass versus edible-portion weight. Supply indicator, not measured individual intake. No conversion to cooked weight or servings.
Fish and seafood. In 2023, fish available for consumption in South Africa was 5.6 kg per person.
South Africa’s population; national per-capita statistic. National fish availability; reference year 2023 is distinct from the profile compilation year. International food-availability compilation based on FAOSTAT; the profile explicitly identifies the data period. Partial coverage: no breakdown by species, shellfish or fresh versus preserved presentation; not all weight bases are detailed here. Supply indicator, not measured individual intake. No conversion to cooked weight or servings.
Eggs. For 2024/25, the agricultural series records 8.43 kg of eggs per person per year for human consumption.
South Africa’s population; national per-capita statistic. Annual egg mass in the human-consumption per-capita column, not tonnes produced. Official agricultural compilation of per-capita consumption for 2024/25; distinguished from total production. Partial coverage: no conversion to egg counts or assumed unit weight; shell inclusion is not detailed here. Supply indicator, not measured individual intake. No conversion to cooked weight or servings.
Milk and dairy products. For the annual March-to-February period 2024/25, the agricultural series records 34.7 kg of fresh milk per person.
South Africa’s population; national per-capita statistic. The “fresh milk” category in the dairy-consumption table; annual March-to-February period. Official agricultural compilation of per-capita consumption for 2024/25; distinguished from total production. Partial coverage: cheese, yoghurt and other dairy are not quantified here; asterisks are not interpreted as zero. No kg-to-litre conversion. Supply indicator, not measured individual intake. No conversion to cooked weight or servings.
Protein sources. In 2018, among studied children aged 1 to under 3 in Gauteng and Western Cape, chicken contributed 16.6% of total protein, maize porridge 15.7%, whole milk 8.2% and beef 5.2%.
Observation period: 2018. Children aged 1 to under 3 in Gauteng and Western Cape; subgroup of 333 participants. Four foods contributing to total protein in the youngest age group; not percentages of children consuming them. Provincial survey with stratified cluster sampling and weighting; caregiver-assisted 24-hour dietary recall and food-composition calculations. Partial provincial coverage: not adults or the whole country, and no complete pulses, fish, egg and dairy breakdown. Published food-contribution percentages are not reconstructed from grams; recall is subject to error.
Fats, flavours and condiments
Cooking fats. In 2024, the agricultural per-capita series records 3.52 kg of sunflower seed oil per person per year.
South Africa’s population; national per-capita statistic. Sunflower seed oil category, without adding other fats or converting to litres. Official agricultural compilation of per-capita consumption; the 2024 row is retained, distinct from provisional 2025. Partial supply coverage, not measured individual intake. It does not quantify all oils, butter or other fats, or cooking-use frequency; the table does not detail all loss adjustments.
Herbs and spices. Pepper is among the most frequent ingredients in the Afrikaans recipe corpus. A chakalaka recipe also uses pepper and paprika.
Qualitative finding from the study published in 2022; exact collection dates are not specified in the methods consulted. An educational chakalaka recipe is added as an example. Partial linguistic coverage, without representing all South Africa or implying dietary intake. The methods consulted do not detail cross-site deduplication. The qualitative order is retained; no percentages are presented without a verified collection date. Not all herbs and spices are covered.
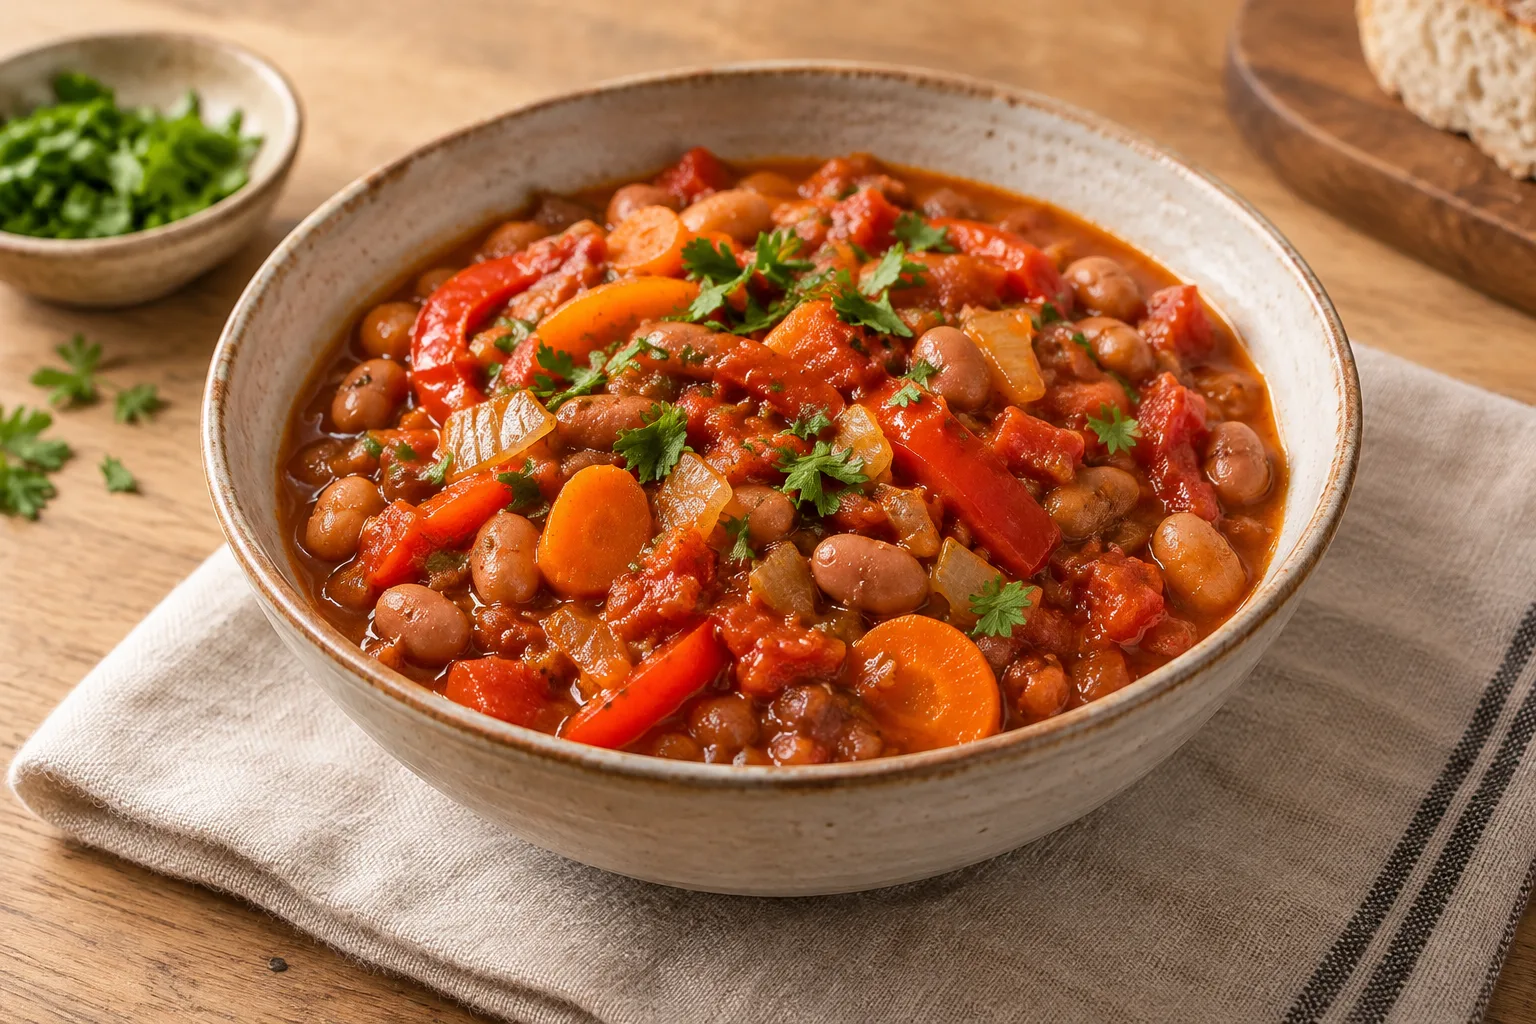
Sauces and condiments. Chakalaka is a spicy vegetable condiment with varying ingredients, often onion, tomato, chilli, carrot, beans and curry. It accompanies pap or bread.
Typical ingredients and uses of one condiment; variants have no single formula. Partial qualitative coverage: no consumption, frequency or ingredient quantities, and no inventory of all the country’s sauces and condiments.
Meal composition
Breakfast composition. In the 2012–2013 Tshwane sample, 30.34% reported bread at weekday breakfast and 28.48% breakfast cereals.
Observation period: 2012–2013. 323 Black adults aged 20–30 from central Tshwane neighbourhoods; convenience sample. Reported presence of two breakfast foods; categories may overlap. Self-administered questionnaire and 24-hour recall on weekday foods and meals; fieldwork October 2012 to January 2013. Partial local coverage: not the whole country or current habits. Participant percentages, not quantities or foods necessarily eaten together; subject to recall and selection error.
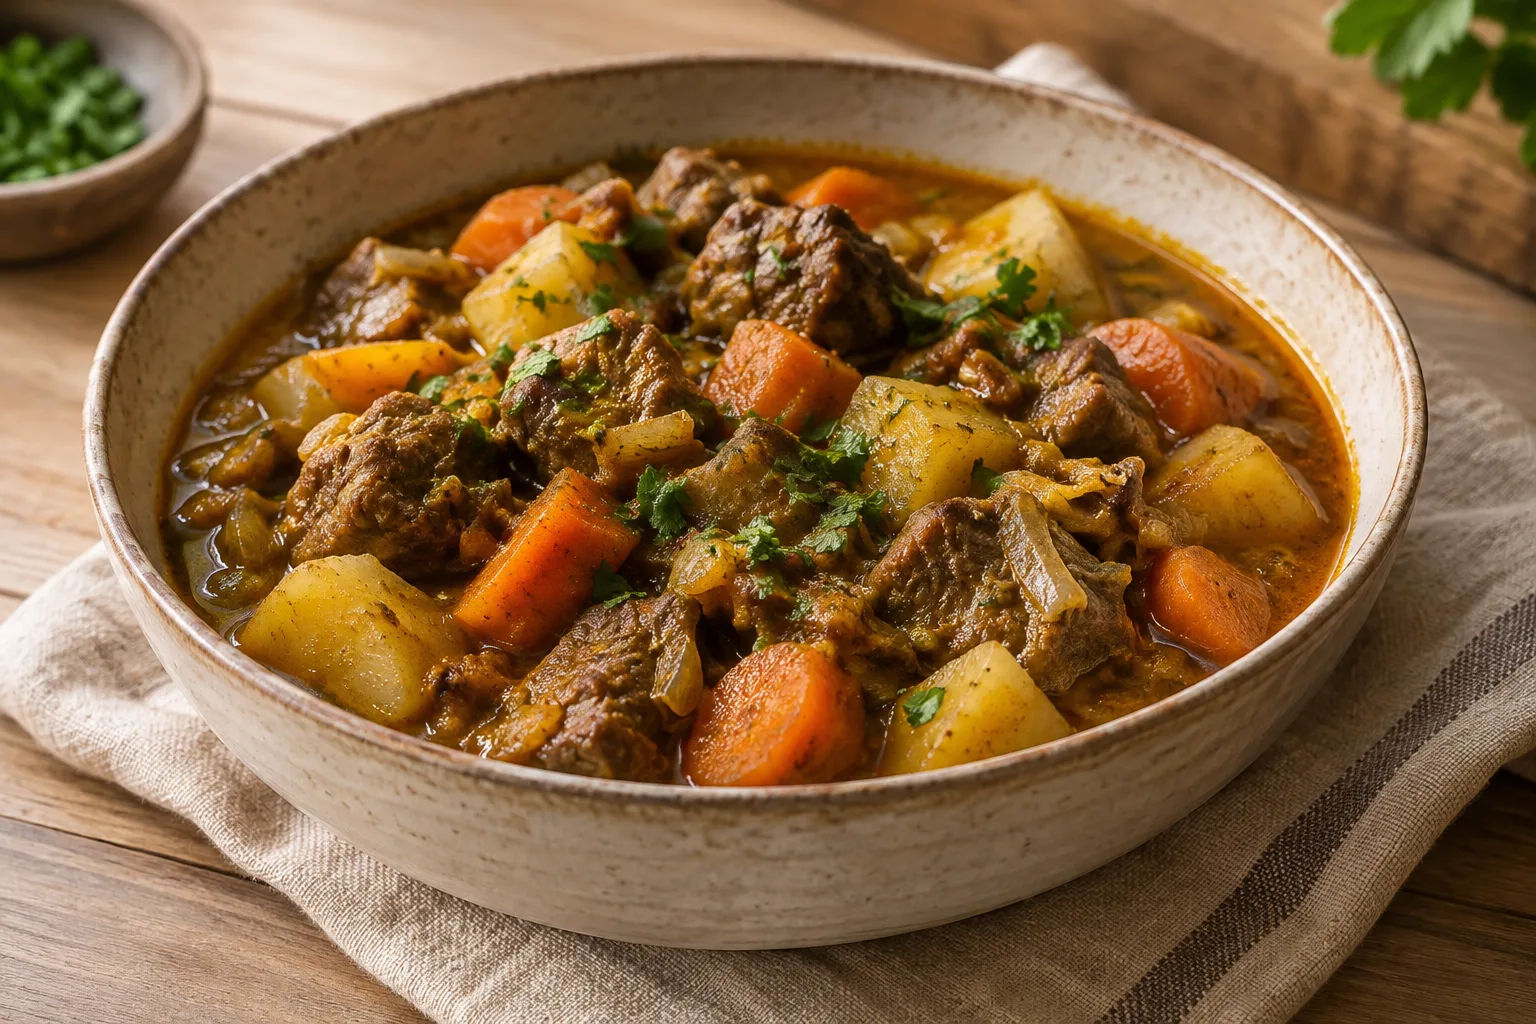
Main meal composition. One example of a dish with an accompaniment is beef stew with amasi, onion, chutney and curry, served with rice or steamed bread.
Ingredients and two possible accompaniments; no mealtime or complete course sequence assigned. Partial qualitative coverage: one illustrative preparation, without frequency, amounts eaten or national representativeness.
Dinner composition. In the 2012–2013 Tshwane sample, 25.08% reported vegetables at weekday supper and 23.84% chicken.
Observation period: 2012–2013. 323 Black adults aged 20–30 from central Tshwane neighbourhoods; convenience sample. Vegetable and chicken presence at supper; not asserted to form one dish. Self-administered questionnaire and 24-hour recall on weekday foods and meals; fieldwork October 2012 to January 2013. Partial local coverage: not the whole country or current habits. Participant percentages, not quantities or foods necessarily eaten together; subject to recall and selection error.
Appetisers and snacks. In the 2012–2013 Tshwane sample, between weekday breakfast and lunch, 16.41% reported fruit or fruit salad and 12.38% savoury snacks.
Observation period: 2012–2013. 323 Black adults aged 20–30 from central Tshwane neighbourhoods; convenience sample. Morning between-meal eating only; not all daily snack intake. Self-administered questionnaire and 24-hour recall on weekday foods and meals; fieldwork October 2012 to January 2013. Partial local coverage: not the whole country or current habits. Participant percentages, not quantities or foods necessarily eaten together; subject to recall and selection error.
Desserts and sweets. An amasi cheesecake combines condensed milk and lemon over a biscuit-and-butter base, topped with granadilla pulp.
Ingredients of one specific dessert; recipe quantities and serving count are not presented as observed intake. Partial qualitative coverage: one illustrative preparation, without frequency, amounts eaten or national representativeness.
Portion sizes. As an illustrative reference in the 2013 South African guideline, a serving is represented by 85 g of lean cooked beef or 158 g of cooked white rice.
Example foods in a per-serving composition table; not survey participants. Cooked weights of two reference servings; 2013 is the guideline publication year, not an observed-intake period. Reading of the illustrative protein-content-per-serving table, retaining its masses without conversion. Partial reference coverage: not observed average portion sizes or an individual prescription. The servings are not asserted to be eaten together or nutritionally equivalent.
Techniques and equipment
Cooking techniques. In the Limpopo small-scale farmer sample, boiling vegetables was the most reported method, followed by steaming.
Qualitative ordering of methods applied to vegetables, not all foods or meals. Partial local coverage: the thesis was published in 2023, but the methods consulted do not specify a verifiable observation period. A qualitative local finding, without national frequency estimates.
Vegetable preparation. Besides boiling and steaming, farmers in the Limpopo sample reported stir-frying, roasting and blanching vegetables.
Small-scale vegetable farmers in six villages of Vhembe and Mopani, Limpopo; sample of 52 participants. Reported vegetable preparation techniques; no quantitative raw/cooked split or pickling data. Questionnaire and observation with multistage cluster sampling; only the qualitative finding is retained. Partial local coverage: the thesis was published in 2023, but the methods consulted do not specify a verifiable observation period. A qualitative local finding, without national frequency estimates.
Food preservation. In the Limpopo small-scale farmer sample, drying vegetables was the most reported preservation method, followed by freezing.
Preservation of vegetables as food, distinguished from seed preservation. Partial local coverage: the thesis was published in 2023, but the methods consulted do not specify a verifiable observation period. A qualitative local finding, without national frequency estimates.
Fermented foods. Amasi is a fermented milk product. Lactic acid bacteria of the Lactobacillaceae family predominated in samples analysed in a South African study.
Fermented food identity and bacterial characterisation, without consumption frequency. Partial coverage: laboratory-sample findings, without national prevalence or extrapolation to every product. Not a home-production procedure or a safety or health-benefit guarantee.
Kitchen equipment. In 2024, 88.3% of households owned an electric stove, 80.9% a refrigerator and 59.3% a microwave oven.
Private households and workers’ hostel residents in South Africa; non-institutional and non-military population. National ownership of three distinct assets; categories may overlap. General Household Survey from January to December 2024 with stratified multistage sampling; national asset-table column. Partial coverage: owning an electric stove does not establish ownership of a separate oven or daily use. Pressure cookers are not quantified; appliance ownership and cooking-energy source are different measures.
Drinks
Everyday drinks. In 2021, 51% reported soft drinks, energy drinks or sports drinks during the previous day or night; 72% reported sweet tea, coffee or cocoa; and 35% fruit juice or fruit drinks.
Civilian, non-institutionalized population of South Africa aged 15 and older. Percentage consuming each group during the previous day or night; categories may overlap. Previous-day dietary questionnaire in a national probability sample; face-to-face interviews. Partial coverage: no volume, usual intake, water or drinks with meals. Published field dates differ between August–November and September–December; both sources agree on 2021.
Coffee and tea preparation. As a rooibos preparation example, it is brewed with boiling water and can be taken black, with honey or with milk; it can also be chilled and served as iced tea.
Preparation and possible additions for a specific infusion. Partial qualitative coverage: not a habits survey or intake measure. Coffee methods, usual cup size and national proportions adding milk or sugar are not documented.
Drinks with meals. In the 2012–2013 Tshwane sample, 4.95% reported tea with weekday supper and 2.48% coffee.
Observation period: 2012–2013. 323 Black adults aged 20–30 from central Tshwane neighbourhoods; convenience sample. Percentage of participants reporting each drink with weekday supper. Self-administered questionnaire and 24-hour recall on weekday foods and meals; fieldwork October 2012 to January 2013. Partial local coverage: not the whole country or current habits. Other meals, drinks and volumes are not covered; tea and coffee were not necessarily consumed together.
Nutrition and dietary patterns
Energy and nutrients. In the 2018 PDIS, mean daily intake in the youngest age group was 4944 kJ of energy, 34.6 g protein, 39.4 g fat, 163.7 g carbohydrate and 10.1 g fibre.
Observation period: 2018. 333 children aged 1 to under 3 in Gauteng and Western Cape. Weighted mean intake, not recommendations, purchases or food availability. Previous-day dietary recall with the caregiver, food composition tables and analysis incorporating the complex sample design. Partial regional coverage: not adults, other ages or the whole country. Subject to recall and portion estimation error and food composition data gaps; units are not converted and energy is not reconstructed.
Salt and sugars. In SAGE 2015, urinary sodium excretion was equivalent to a median of 6.3 g salt per day. Separately, in the 2018 PDIS, the youngest children had a mean free sugar intake of 30.9 g per day.
Observation period: 2015; 2018. Salt: adult SAGE subsample with complete data from 874 participants in South Africa. Sugars: 333 children aged 1 to under 3 in Gauteng and Western Cape. Two distinct populations and periods. Free sugars include added sugars and those in honey, syrups, fruit juices and concentrates; this is not total sugar. Published salt equivalent derived from sodium in 24-hour urine; free sugars estimated through dietary recall and a specific calculation because food composition tables lacked that variable. Partial coverage: the samples are not combined and salt is not presented as grams of sodium. Incomplete urine collection can introduce selection bias; child data do not represent adults or the country and do not measure all sugars.
Dietary patterns. In the 2022 Rhodes survey, approximately 31% of participants identified with a plant-based diet, a category that included flexitarians.
Observation period: 2022. 300 students who voluntarily responded to an online survey at Rhodes University, Makhanda. Dietary self-identification. The category includes vegan, vegetarian, ovo-vegetarian, pescatarian and flexitarian diets; it does not mean veganism. Open questionnaire circulated through university mailing lists and social groups. Definitions were provided: vegan excludes animal products; vegetarian excludes meat but allows dairy or eggs; flexitarian is mostly plant-based with occasional meat. Partial local coverage: self-selection and possible social desirability bias; not a national prevalence estimate. The flexitarian definition is imprecise. Individual proportions are not reconstructed from published aggregates.
Shopping, prices and waste
Food expenditure. In the 2018 sample, median monthly household food expenditure was 1350 ZAR.
122 women aged 60–85 in Khayelitsha and Langa, Cape Town; convenience sample from low-income communities. Monthly household spending in rand for the observation period. Interviews on food acquisition and spending conducted April–December 2018; self-reported responses. Partial local coverage: a median, not a mean or per-person spending. No household budget share or conversion to current prices.
Cost of a common basket. In October 2026, the monitored fixed 44-food basket cost 5512.53 ZAR as the weighted average across study areas.
Observation period: October 2026. Johannesburg, Durban, Cape Town, Pietermaritzburg, Mthatha, Springbok and Mtubatuba study areas. Monthly basket with specified quantities, designed as a proxy for low-income families of seven. Shelf prices collected during the first week of the month; fixed quantities and area-weighted average. Partial coverage: not every household’s basket and not nutritionally complete. Brands and outlets change with affordability; not national average spending or a comparable basket without checking quantities.
Cost of specific meals. Wimpy advertised the promotional Mighty Combo for 179.90 ZAR: chicken, pork ribs, boerewors and onion rings, with regular chips or salad.
Wimpy South Africa menu offer. Advertised price for the promotional plate; valid 15 September–23 November 2026. Reading the menu and validity conditions published by the chain itself. Partial coverage: one chain’s offer, subject to conditions. Not a national average, home recipe cost or portion comparison with other dishes.
Grocery shopping locations. The local sample documented food purchases at supermarkets, small spaza shops and street vendors.
Types of outlets used in the sample. Partial qualitative coverage: not spending shares by channel or a national distribution. Online or market purchases are not quantified.
Shopping frequency. Monthly and several-times-monthly supermarket visits were documented, alongside spaza purchases at least once a week.
Reported frequencies by outlet type; no average number of visits is calculated. Partial local qualitative coverage: no population-wide weekly trip estimate or mean basket size. Percentages with inconsistent table counts and denominators are not reported.
Prepared food and delivery. In the 2018 sample,54.1% bought food at fast-food outlets; recorded items included chicken and chips.
122 women aged 60–85 in Khayelitsha and Langa, Cape Town; convenience sample from low-income communities. Reported purchase of ready-to-eat food; not daily consumption. Interviews on food acquisition and spending conducted April–December 2018; self-reported responses. Partial local coverage: no home-delivery measure, national frequency, spending per order or population-wide intake.
Household food waste. The study estimated 11.61 kg per person per year of food waste in municipal bins in Johannesburg, sampled in 2014, and 7.98 kg in Ekurhuleni, sampled in 2016.
Observation period: 2014;2016. Urban households served by municipal collection routes in Johannesburg and Ekurhuleni. Food waste including edible and inedible parts; only material placed in municipal bins. Bulk waste sampling with random grab subsamples in summer; published per-person annualisation using the 2011 census. Partial urban summer coverage: excludes rural areas, drains, composting and food fed to animals. Not the national total or whole supply-chain loss; specific foods and causes are not identified here.
Seasons and celebrations
Seasonal produce. As an indicative agricultural calendar, South African apples are typically harvested from January to May, with peak activity between February and April. Production is concentrated in Western Cape and Eastern Cape.
Typical local harvest window for one fruit, distinguished from year-round commercial availability through storage. Partial coverage: not a complete fruit and vegetable calendar or a guarantee for every variety, region or season. Commercial supply and imports do not equal local harvest.
Celebration food. Heritage Day is celebrated on 24 September. As a culinary example associated with this occasion, a university recipe book offers beef stew with amasi and onion, which can be served with rice or steamed bread.
Fixed celebration date and an editorial example of a dish and ingredients, without attributing it to every household or region. Partial cultural coverage: no measure of how many people cook the dish and no representation of all traditions, festivals or movable dates in the country.