Food and eating habits
How people eat in Ghana
50 indicators exploring everyday meals, ingredients and food culture. Information is completed progressively from documented evidence.
50 of 50 indicators with documented information
Not all data are comparable: food supply, purchases and intake are different measures. Check the period, population and method for each finding. Qualitative descriptions do not establish percentages or amounts.
Timing and company
8/8
| Indicator | Findings and context |
|---|---|
| Meal times |
In the local 2017 sample, eating peaks occurred at 7–8 am, 12–1 pm and 5–7 pm. These describe the studied neighbourhoods, not a national schedule. Scope, method and limitations
|
| Meals per day |
The local 2017 sample reported a mean of 3.3 eating episodes per day, including food and beverages except water alone; this is neither 3.3 main meals nor a national average. Scope, method and limitations
|
| Meal duration |
Of the eating episodes reported by the local 2017 sample, 40.1% lasted under 10 min, 47.0% lasted 10–29 min and 12.9% at least 30 min. A national mean duration was not calculated. Scope, method and limitations
|
| Daily energy distribution |
In the November–December 2008 study, the table for the Tolon-Kumbungu school-feeding group attributes 24% of measured daily energy intake to school lunch. That table is based on 174 participating schoolchildren. This is neither a national breakfast/lunch/dinner allocation nor a percentage of energy requirements. Scope, method and limitations
|
| Weekdays and weekends |
One Kaadjanor account collected between May and July 2019 describes a mother delegating cooking to her sister when working at weekends, while doing the weekday cooking herself. This illustrates a specific household reorganisation; it does not establish meal schedules or dietary changes across Ghana. Scope, method and limitations
|
| Eating at home and away |
In the local 2017 sample, 81.9% of eating episodes took place at home and 6.3% on the street. Eating at home does not establish that the food was prepared there; these are not national percentages. Scope, method and limitations
|
| Cooking frequency |
In the May–July 2019 interviews, 14 of 20 rural informants in Asaase Kokoo (70.0%) reported cooking twice daily every day. In Kaadjanor, 7 of 13 peri-urban informants (53.8%) reported cooking once daily on three or four days per week. This is a local purposive sample, not a national cooking frequency. Scope, method and limitations
|
| Eating together |
In the local 2017 sample, 45.4% of eating episodes were alone and 47.3% with family. The unit is an eating episode, not the proportion of people who usually eat alone. Scope, method and limitations
|
Pantry and recipes
2/2
| Indicator | Findings and context |
|---|---|
| Most consumed ingredients |
Food availability in 2021 for three starchy commodities: cassava and products, 217.99 kg/capita/year; yams, 147.39; maize and products, 31.72. These are national food-supply estimates, not quantities eaten. Scope, method and limitations
|
| Ingredient prevalence in recipes |
Catalogue sample: 6 published recipes. Ingredient presence, counted as recipes in the sample: Salt 5/6; Water 5/6; Garlic 3/6; Olive oil 2/6; Lemons 2/6; Red bell pepper 2/6; Green pepper 2/6; Red onion 2/6; Fermented corn dough 2/6; Oil for frying 2/6; Cayenne pepper 2/6; Onion 1/6; Lemon juice 1/6; Chicken stock 1/6; Ripe bananas 1/6; Peanut butter 1/6; White fish 1/6; Scotch bonnet chile 1/6; Long-grain rice 1/6; White sugar 1/6; Canned red beans 1/6; Dried waakye leaves 1/6; Fine salt 1/6; Cornstarch 1/6; Fermented cassava dough 1/6; Whole tilapia 1/6; Medium onions 1/6; Canned tomato 1/6; Grated fresh ginger 1/6; Whole tilapia 1/6; Cassava dough 1/6; Fresh herbs 1/6; White corn flour 1/6; Dried corn husks 1/6; Tomato paste 1/6; Canola oil 1/6; Canned stewed tomatoes 1/6. These are catalogue counts, not measures of the Ghanaian diet. Scope, method and limitations
|
Cereals and plant foods
6/6
| Indicator | Findings and context |
|---|---|
| Cereals and cereal products |
In 2021, food availability of maize and products was 31.72 kg/capita/year. This is national food-balance supply, not cooked-maize weight or individual intake; it does not quantify all cereals. Scope, method and limitations
|
| Bread |
The intake list for the neighbourhoods studied in 2017 includes white bread, with the names sugar bread, butter bread and tea bread. These names do not specify recipes or establish national per-capita amounts. Scope, method and limitations
|
| Pulses |
The food list from the local 2017 sample includes red beans and baked beans. It also includes waakye, described as cooked rice and beans. It provides neither national per-capita amounts nor a dry-to-cooked weight equivalence. Scope, method and limitations
|
| Vegetables |
In the national 2023 survey, reported vegetable consumption averaged 2.7 servings per day and 6.0 days in a typical week. The two means have different response bases; they do not identify the most consumed vegetables or their weighed amounts. Scope, method and limitations
|
| Fruit |
In the national 2023 survey, reported fruit consumption averaged 0.8 servings per day and 2.2 days in a typical week. These quantity and frequency indicators have different response bases; they are neither weighed grams nor a ranking of fruits. Scope, method and limitations
|
| Potatoes, roots and tubers |
Food availability in 2021: cassava and products, 217.99 kg/capita/year; yams, 147.39. These are national food-balance commodity groups, not quantities eaten by individuals or cooked-root weights. Scope, method and limitations
|
Protein foods
5/5
| Indicator | Findings and context |
|---|---|
| Meat |
Meat food supply was 20.90 kg per person per year in 2021. Scope, method and limitations
|
| Fish and seafood |
Fish and seafood food supply was 23.60 kg per person per year in 2021. Scope, method and limitations
|
| Eggs |
Egg food supply was 1.07 kg per person per year in 2021. It is not converted to a number of eggs. Scope, method and limitations
|
| Milk and dairy products |
Food supply for the milk excluding butter category was 13.17 kg per person per year in 2021. This is not presented as the amount of liquid milk drunk. Scope, method and limitations
|
| Protein sources |
In the local school sample observed in 2008, animal-source protein accounted for a published average of 4% of protein intake. Scope, method and limitations
|
Fats, flavours and condiments
3/3
| Indicator | Findings and context |
|---|---|
| Cooking fats |
In 2021, food supply was 2.25 kg of palm oil, 0.17 kg of coconut oil and 0.42 kg of animal fats per person per year. These are selected categories and are not added together. Scope, method and limitations
|
| Herbs and spices |
Across the 6 catalogue recipes reviewed in 2026, Cayenne pepper occurs in 2; Scotch bonnet chile, grated fresh ginger and fresh herbs occur in 1 each. The fresh-herbs label does not identify species. Scope, method and limitations
|
| Sauces and condiments |
A teaching example of shito combines powdered herring and shrimp with tomato, onion, spices and oil to make a hot sauce. It is an illustrative version, not a single recipe for all Ghana. Scope, method and limitations
|
Meal composition
6/6
| Indicator | Findings and context |
|---|---|
| Breakfast composition |
In the local interviews, 86.7% mentioned porridge as a common breakfast option. Tea with bread, tuo zaafi and rice dishes were also mentioned. Scope, method and limitations
|
| Main meal composition |
For lunch, 100% of interviewees mentioned tuo zaafi. This is a response about commonly eaten foods in that sample, not evidence that lunch is the main meal by energy. Scope, method and limitations
|
| Dinner composition |
For supper, 93.3% of interviewees mentioned tuo zaafi. The table also records rice, fufu, yam, banku and pigeon peas; options are not mutually exclusive. Scope, method and limitations
|
| Appetisers and snacks |
As a snack option, 63.3% of interviewees mentioned biscuits or pastries. This is the share mentioning that option, not the percentage of snacks eaten or a daily frequency. Scope, method and limitations
|
| Desserts and sweets |
The local food-consumption list includes sweet pies or tarts, pastries, biscuits, chocolate, sweets, ice cream, groundnut cake, doughnuts and bofrot. It documents kinds of sweets without establishing that they were eaten as dessert or how often they followed meals. Scope, method and limitations
|
| Portion sizes |
Median lunch portion size was 1037 g for the group without school feeding, eating lunch at home, and 456 g for the group receiving lunch at school. These are different meals and settings, not a standard Ghanaian portion. Scope, method and limitations
|
Techniques and equipment
5/5
| Indicator | Findings and context |
|---|---|
| Cooking techniques |
Fried foods were present in 42.4% of recorded eating episodes. This is their presence in episodes in this local sample, not the percentage of food weight or frequency of household frying-pan use. Scope, method and limitations
|
| Vegetable preparation |
One rural informant described grinding tomatoes and boiling the paste for storage. This is a qualitative case of heat treatment of a vegetable, without verified raw-versus-cooked preparation shares. Scope, method and limitations
|
| Food preservation |
Among the rural households interviewed, 55.0% reported smoking and drying fish and meat for storage. These are reported sample practices, not validated preservation guidance. Scope, method and limitations
|
| Fermented foods |
The school study identifies dawadawa as a condiment made from fermented Parkia biglobosa seeds. It documents this product in the diet studied, without national frequency or a fermentation procedure. Scope, method and limitations
|
| Kitchen equipment |
Refrigerators were owned by 41.9% of households and freezers by 14.8%. These are separate ownership indicators and are not added. Scope, method and limitations
|
Drinks
3/3
| Indicator | Findings and context |
|---|---|
| Everyday drinks |
Fruit juice or fruit-flavoured drinks were reported by 10.0%, and sodas, malt, sports or energy drinks by 19.0%, during the preceding day or night. These are two separately published categories, not their shares of all beverages. Scope, method and limitations
|
| Coffee and tea preparation |
The combined category of sweetened tea, coffee, herbal drinks and other sweetened beverages was reported by 17.4% for the preceding day or night. Its note includes Milo, tea with sugar and coffee with sugar; this is not a separate tea or coffee estimate. Scope, method and limitations
|
| Drinks with meals |
In the local sample’s aggregate time profile, sugar-sweetened beverage consumption tended to peak with or just after meals. This describes an episode pattern, without percentages of people taking each beverage with each meal. Scope, method and limitations
|
Nutrition and dietary patterns
3/3
| Indicator | Findings and context |
|---|---|
| Energy and nutrients |
Estimated mean energy was 2611 kcal/day in the rural group and 2295 kcal/day in the urban group. Energy percentages from carbohydrate, fat and protein were 56.5%, 31.3% and 11.5% in the rural group, and 54.4%, 31.6% and 13.6% in the urban group, respectively. Scope, method and limitations
|
| Salt and sugars |
Published median salt-equivalent intake estimated from 24-hour urine was 8.3 g/day. This is the substudy estimate, not a new sodium conversion or a sugar measurement. Scope, method and limitations
|
| Dietary patterns |
Adherence to the roots, tubers and plantain pattern was higher in the rural group; adherence to the rice, pasta, meat and fish pattern was higher in the urban group. These are statistical food patterns, not self-reported vegetarian, vegan or flexitarian categories. Scope, method and limitations
|
Shopping, prices and waste
7/7
| Indicator | Findings and context |
|---|---|
| Food expenditure |
Published mean actual food expenditure: 1931 GH¢ per person per year; food, including imputed expenditure, accounts for 42.9% of total expenditure. Scope, method and limitations
|
| Cost of a common basket |
Published minimum cost of a modelled urban food basket: 6.44 GHS per family per day. Scope, method and limitations
|
| Cost of specific meals |
Hallmark Café’s menu lists Shredded Chicken Jollof at 90 GHS per dish. Scope, method and limitations
|
| Grocery shopping locations |
In the rural locality, local markets supplement home-produced foods; in the peri-urban locality, accounts mention markets and grocery stores. Scope, method and limitations
|
| Shopping frequency |
49% reported food shopping 2–3 times per week; 24.8% once per week; and 14.5% 4–6 times per week. Scope, method and limitations
|
| Prepared food and delivery |
Accounts describe some meals bought from vendors outside the home. One rural interviewee mentions fried yam and, sometimes, gari with sugar and groundnuts. Scope, method and limitations
|
| Household food waste |
The published household food-waste estimate is 84 kg per person per year, based on a historical Ghanaian study. Scope, method and limitations
|
Seasons and celebrations
2/2
| Indicator | Findings and context |
|---|---|
| Seasonal produce |
Mango has a May–July season and a short December–February season in southern Ghana. Citrus harvests are described from October to March and April to July, depending on variety; pineapple is grown throughout the year. Scope, method and limitations
|
| Celebration food |
At Homowo, Ga communities in Greater Accra prepare and share kpokpoi, steamed maize mixed with palm oil; it is also sprinkled ceremonially. The celebration recalls overcoming a famine. Scope, method and limitations
|
Coverage in progress
The editorial guide for this country is in preparation. You can already explore its recipes; regional attributions are added when documented.
Guide available in other languages: Español
Places and communities
One country, many cuisines
An initial selection of regions to explore. Culinary boundaries may differ from administrative divisions.
Franja forestal y Ashanti
Norte de Ghana
Cook
Recipes connected with Ghana
Each recipe documents one version. Geographic associations do not imply an exclusive origin.
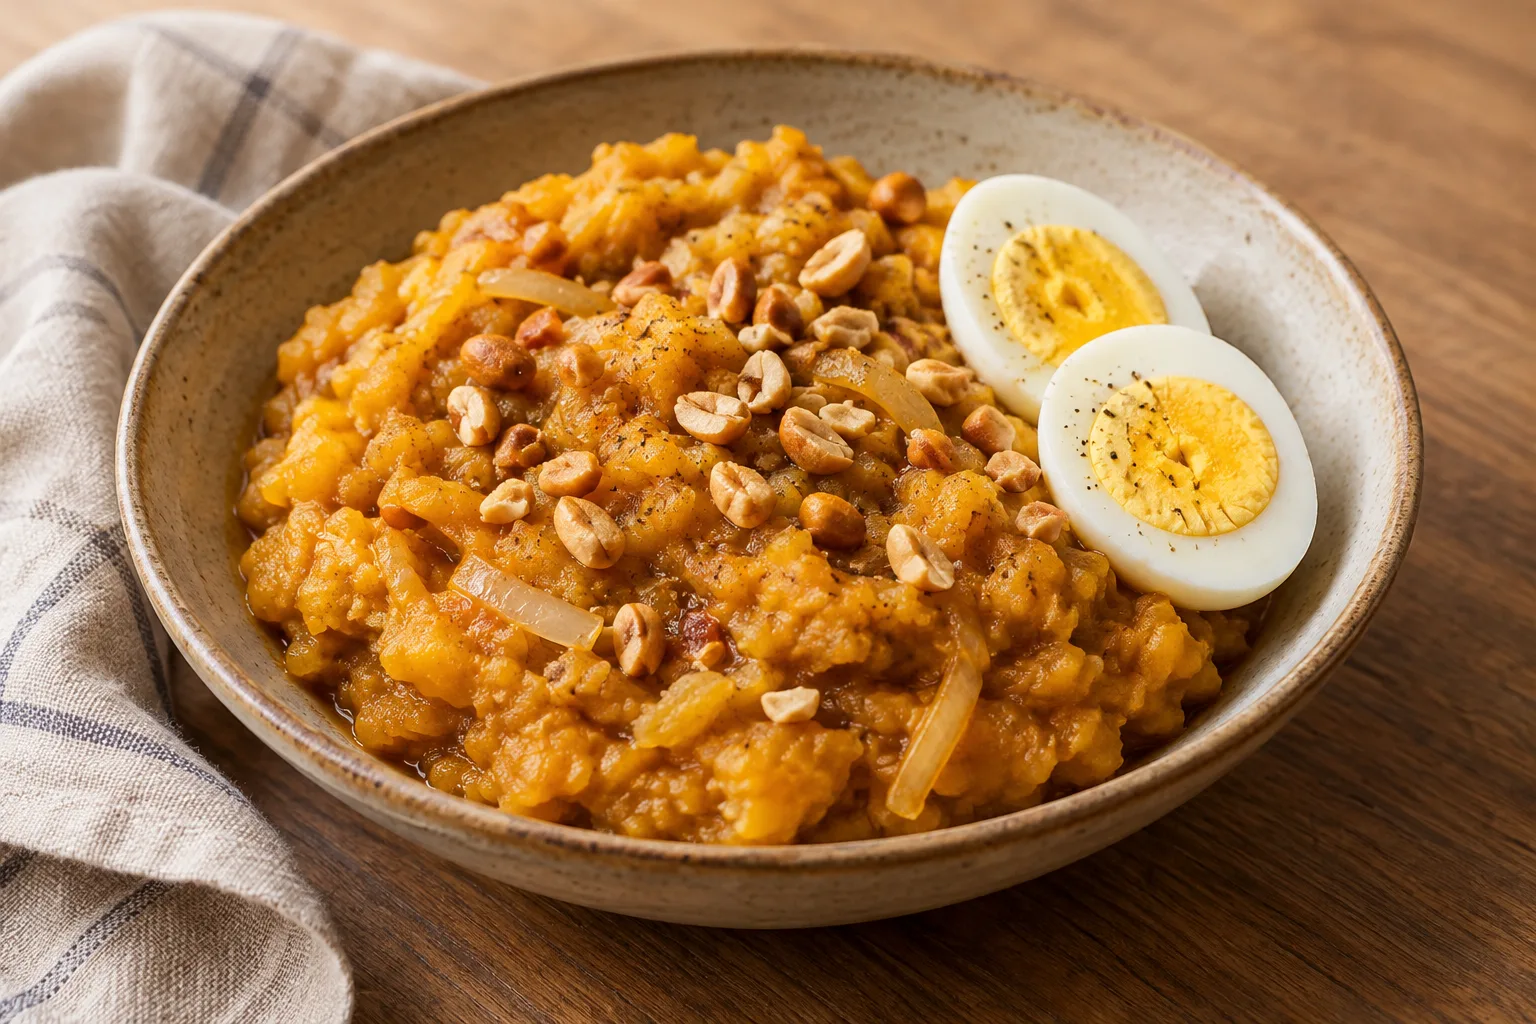
Ghanaian Plantain Eto
A Ghanaian mash of cooked plantain blended with palm oil and onion, served with peanuts and hard-boiled egg.
View recipe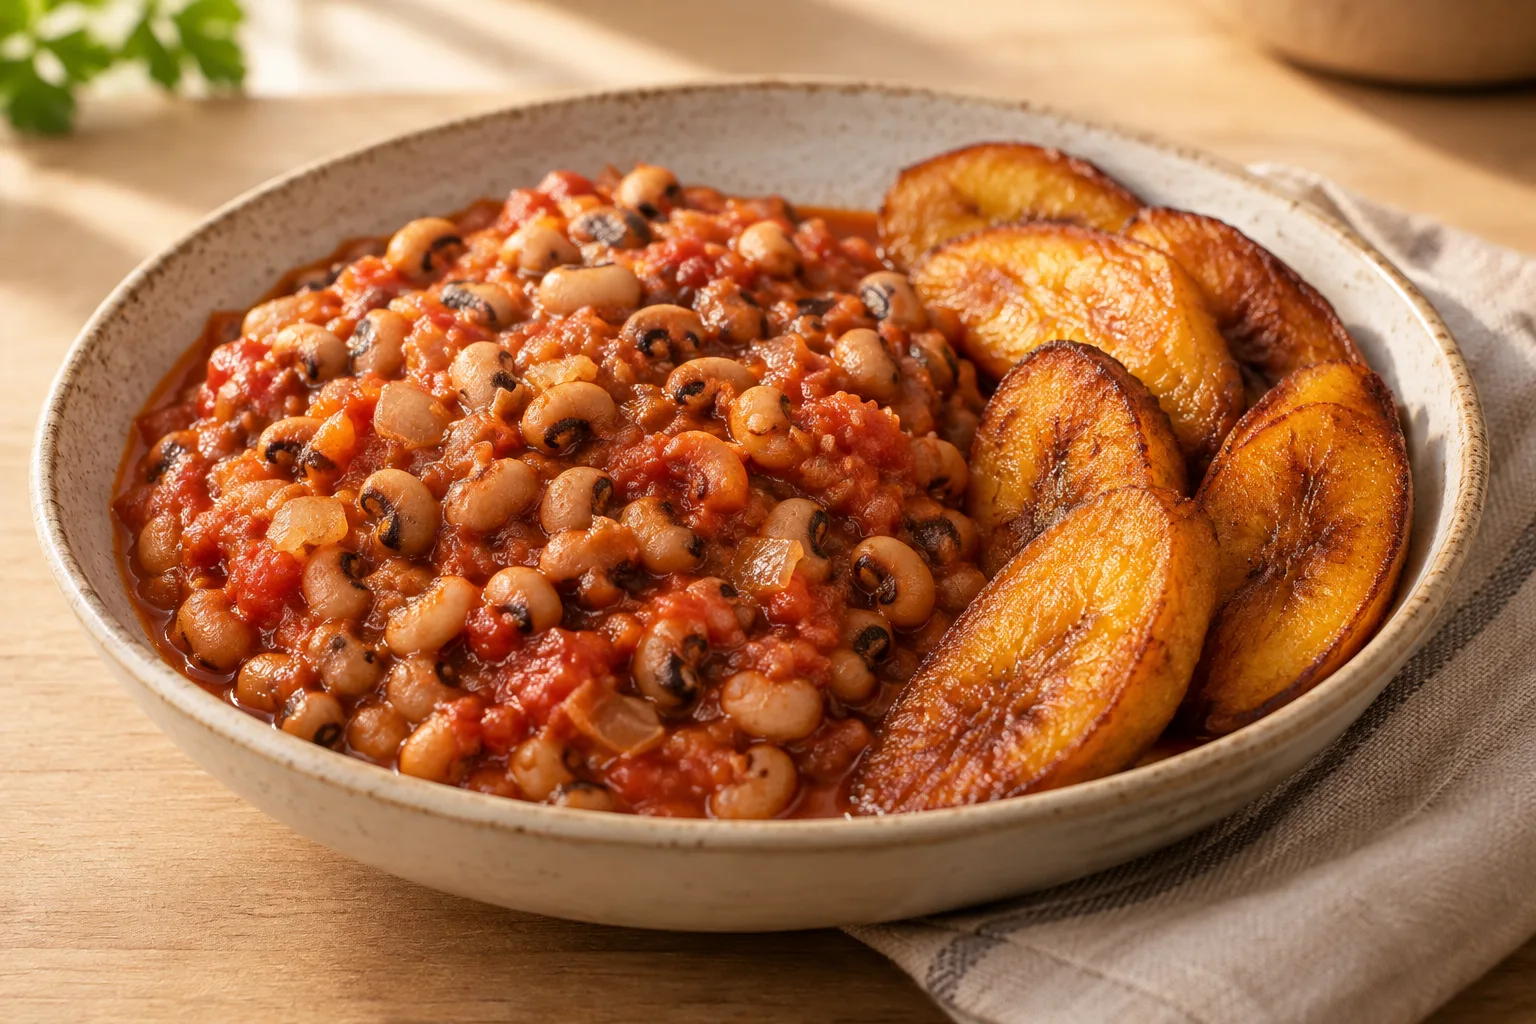
Ghanaian Red Red with Fried Plantain
A Ghanaian stew of black-eyed peas with tomato, onion and paprika, served with fried ripe plantain. Makes 4 servings.
View recipe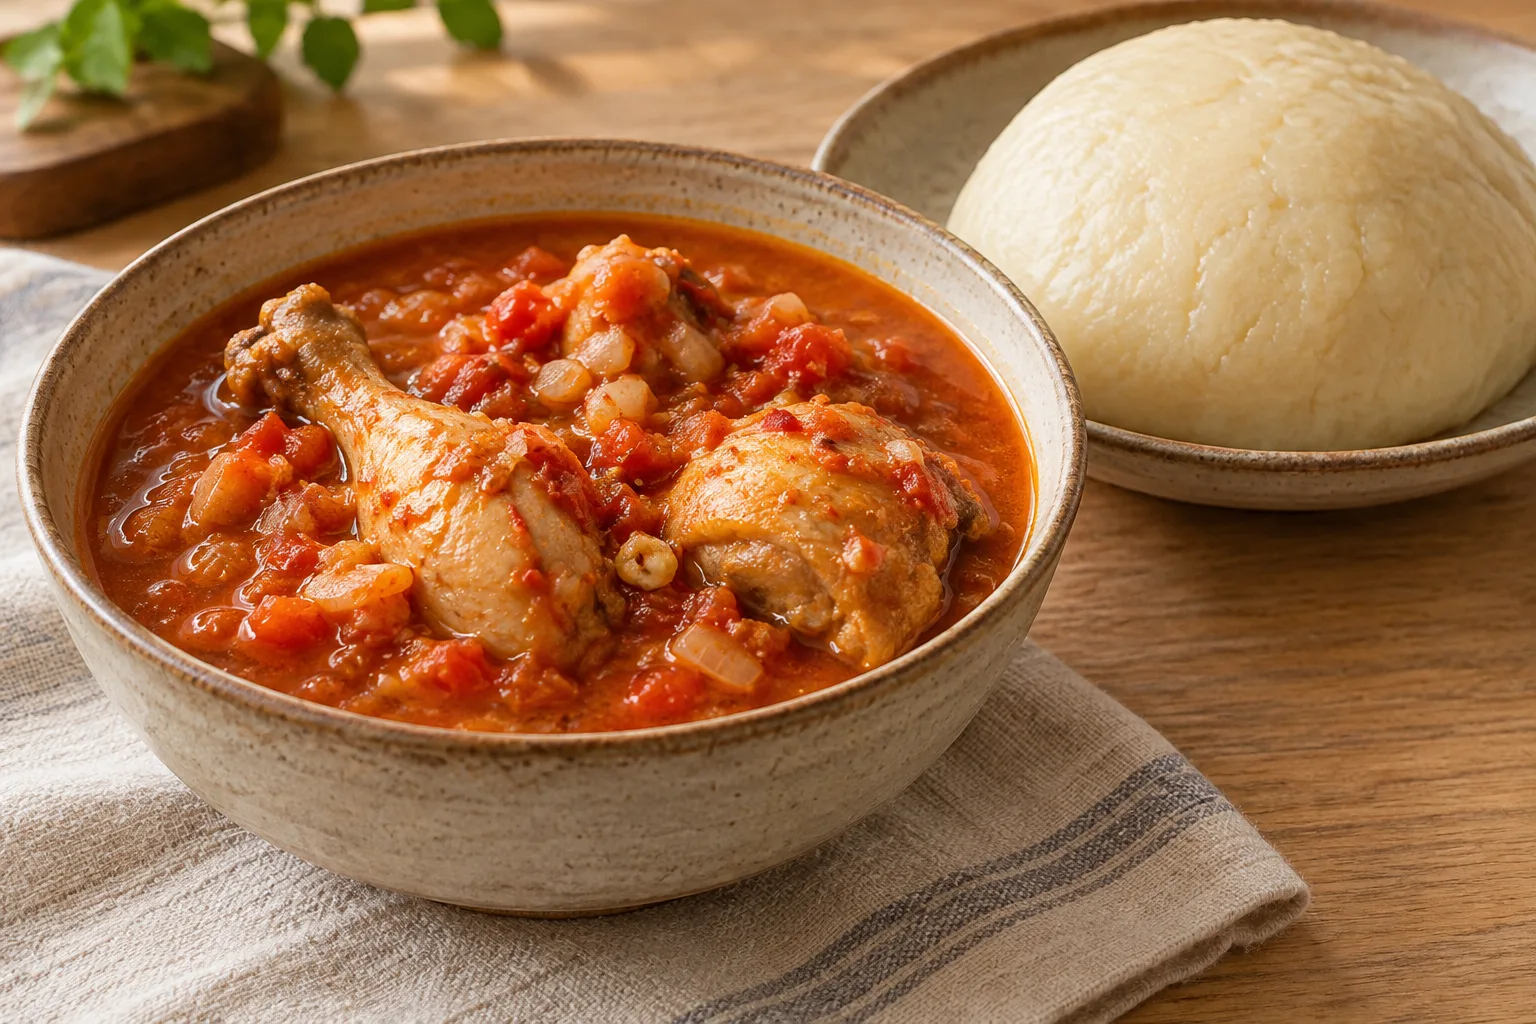
Fufu with Light Chicken Soup
Light chicken soup with tomato and aromatics, served with elastic fufu made from cassava and green plantain. Serves 4; estimated preparation: 30 minutes, cooking: 60 minutes, and resting: 10 minutes.
View recipe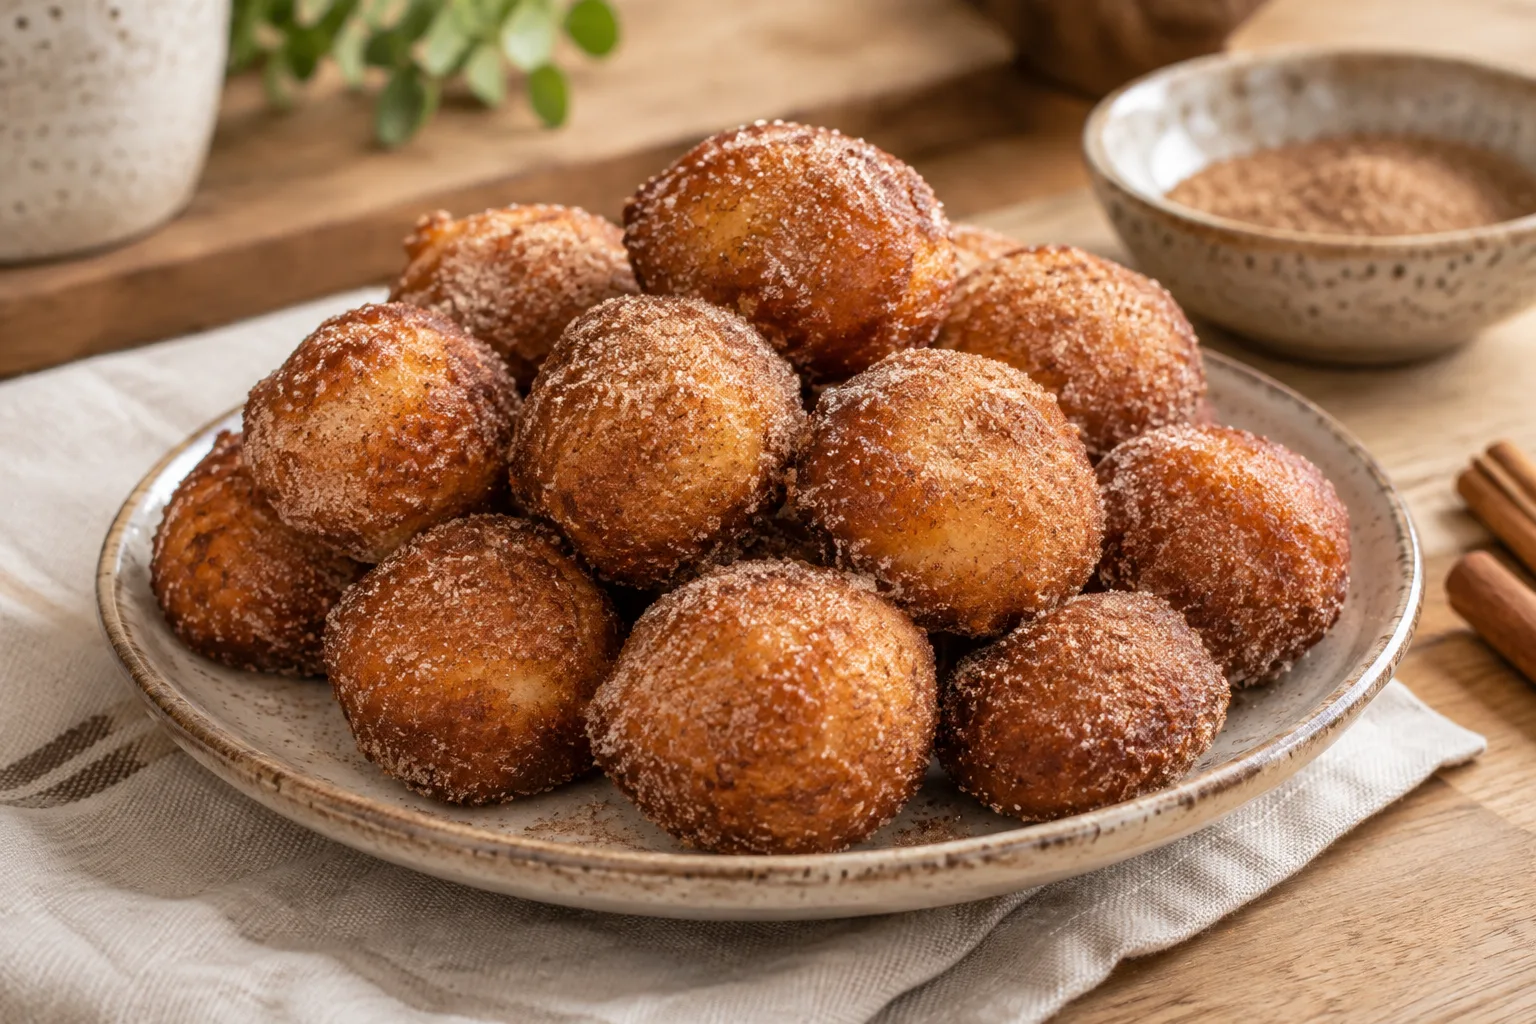
Ghanaian bofrot
Ghanaian yeast-raised doughnuts, spiced, fried, and coated in cinnamon sugar. The recipe makes about 18; preparation times are approximate.
View recipe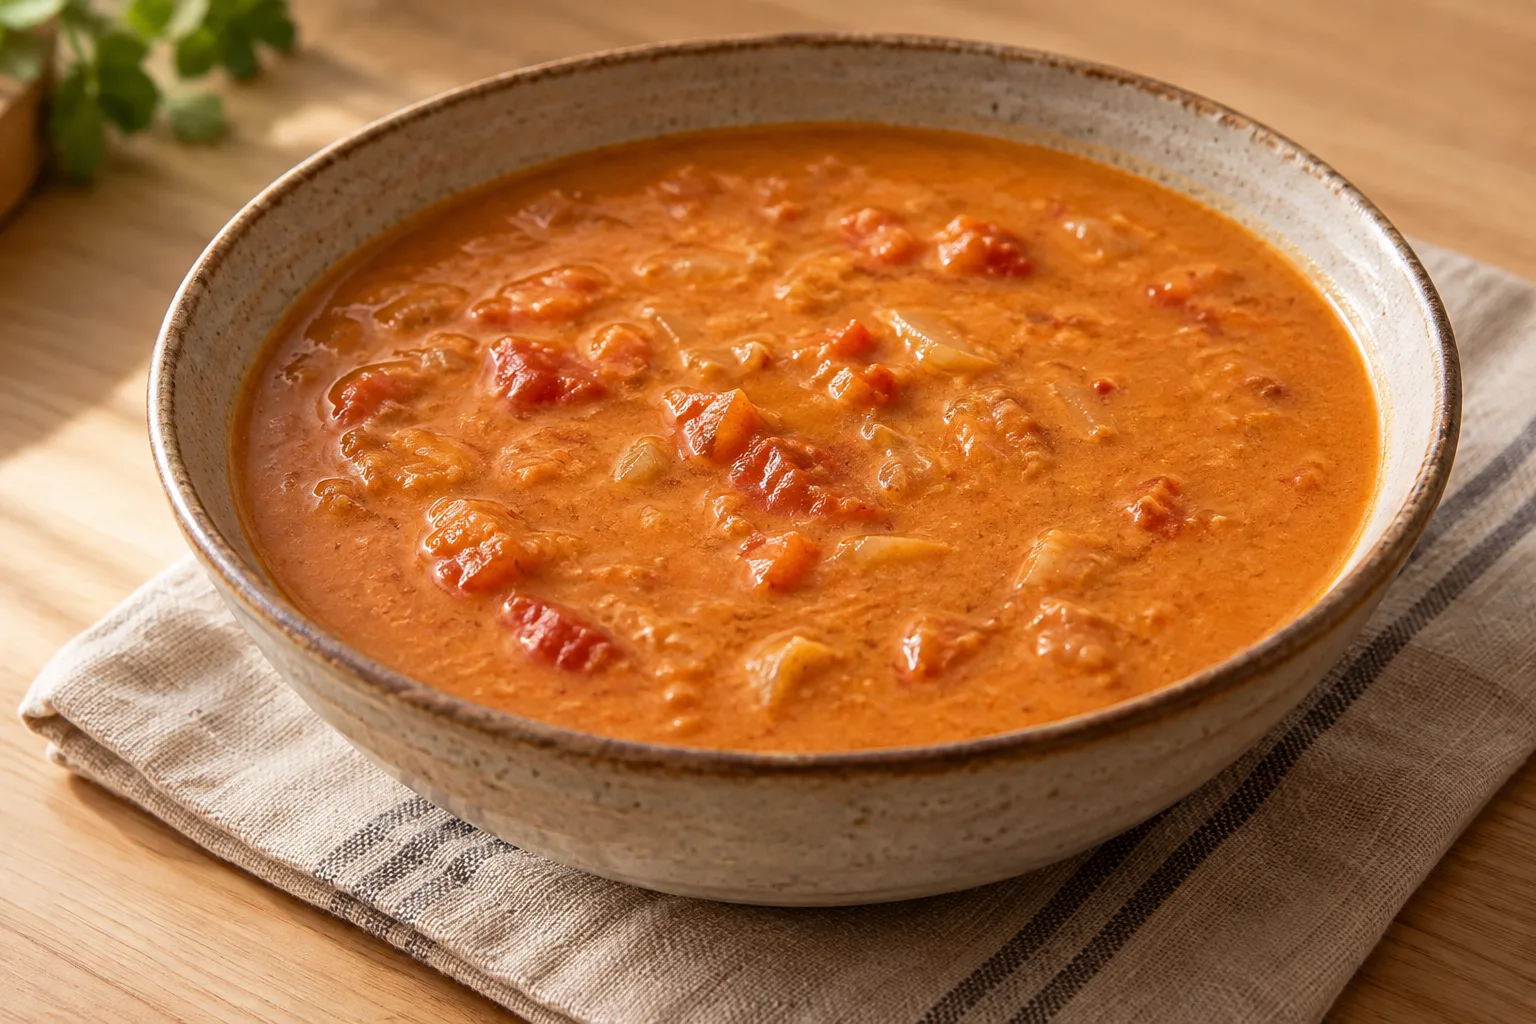
Nkate nkwan: Ghanaian peanut soup
A Ghanaian peanut soup with tomatoes, onion and chile, inspired by nkate nkwan. Serves 6.
View recipe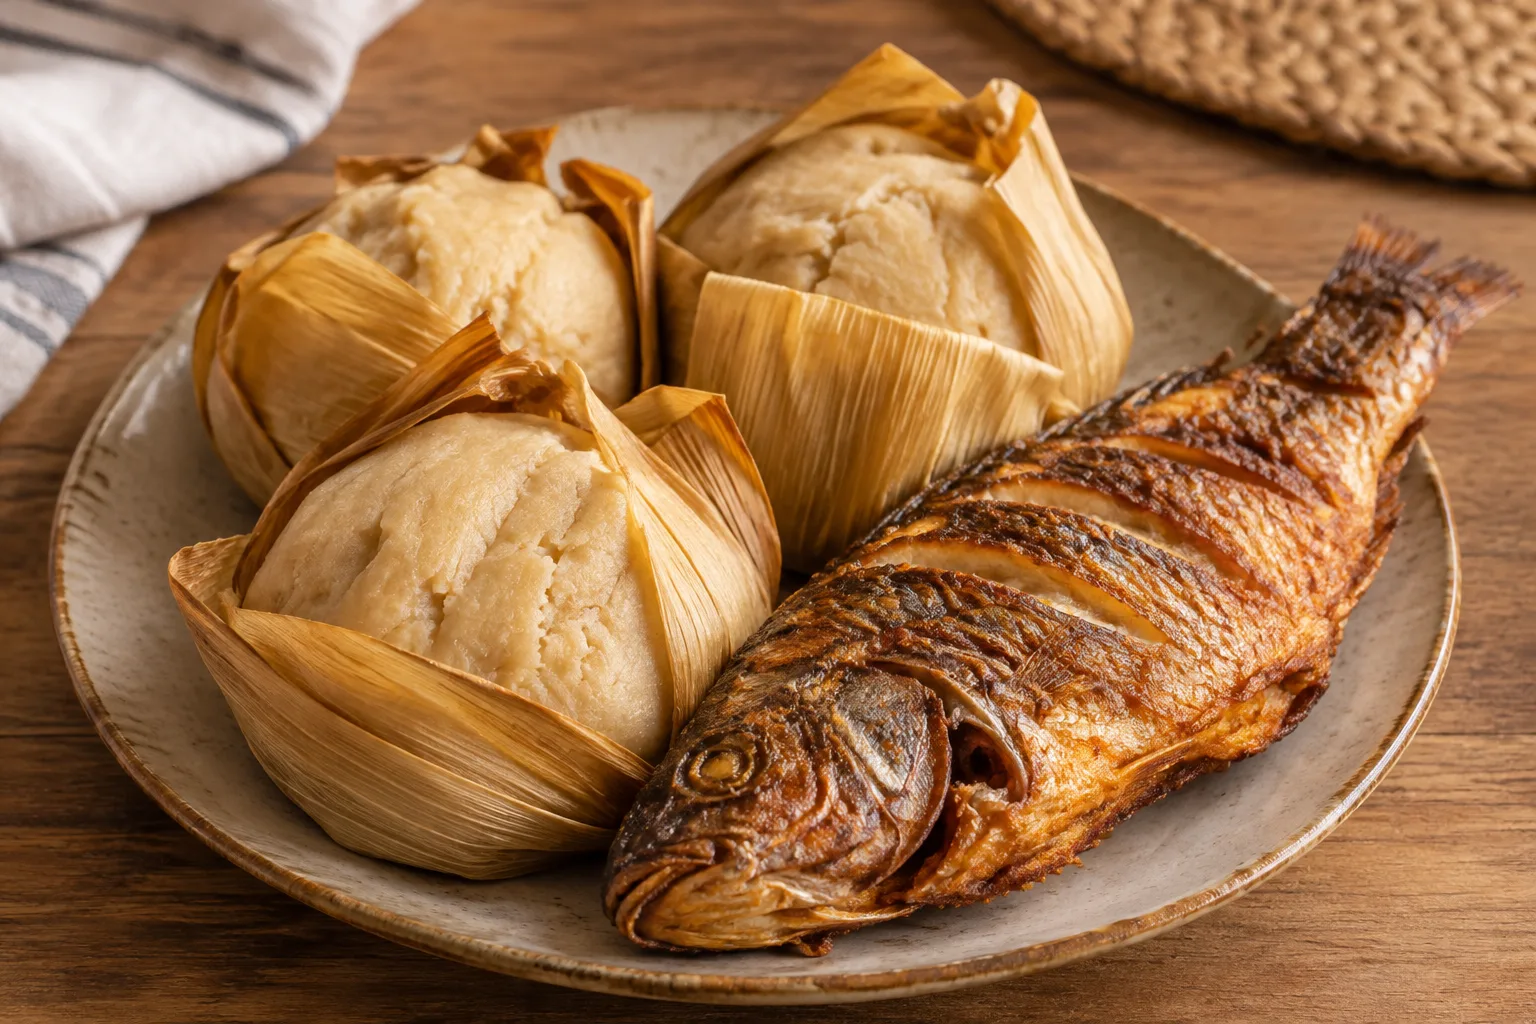
Ghanaian Kenkey with Fried Fish
Fermented-maize kenkey, cooked in two stages, wrapped in corn husks, and served with fried fish. Serves 4.
View recipe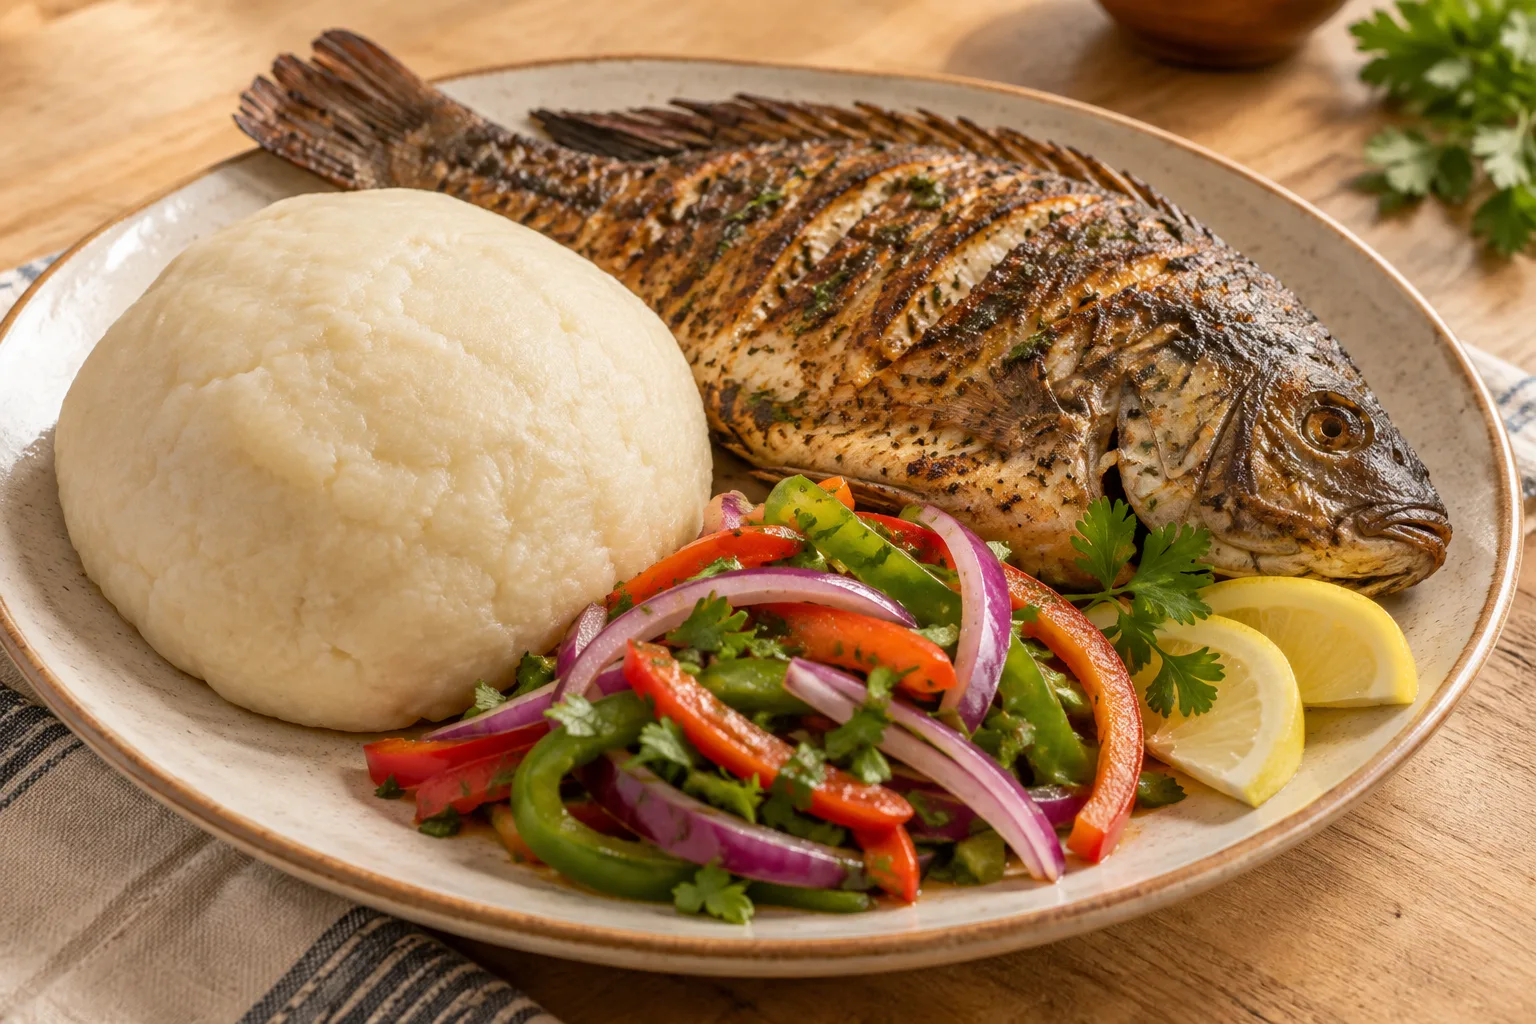
Ghanaian Banku with Oven-Baked Tilapia
Slightly tangy corn-and-cassava dough served with whole oven-baked tilapia, herbs, and fresh sliced vegetables.
View recipe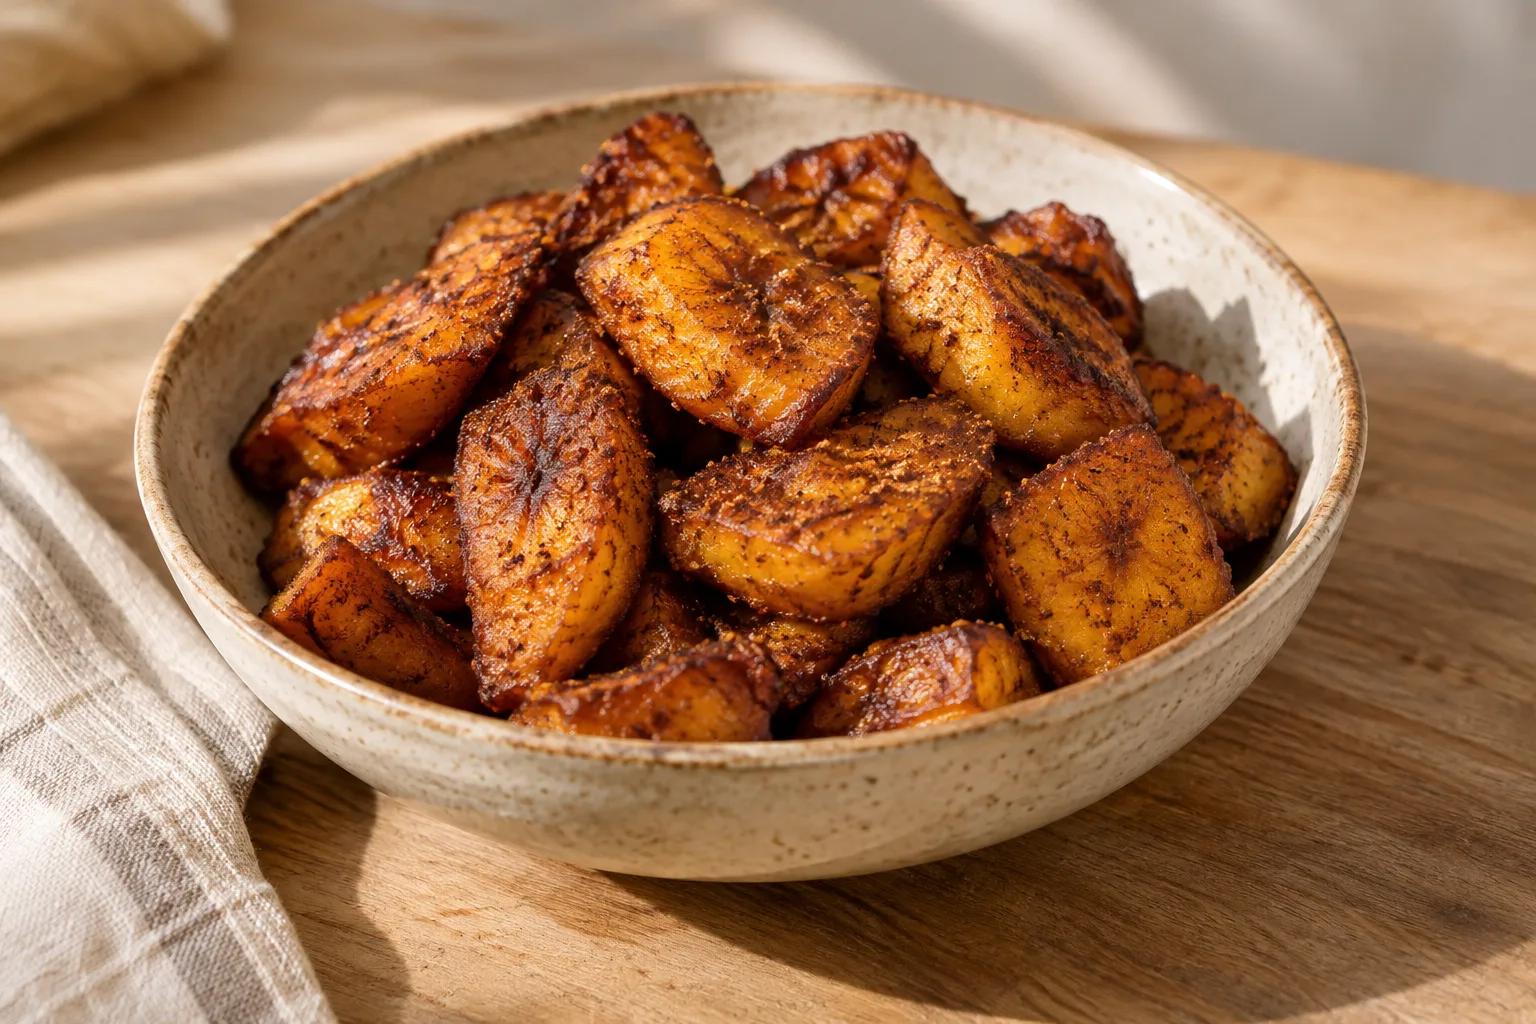
Ghanaian Kelewele
Ripe plantain fried with ginger, cayenne, lemon and salt; serve hot as a snack.
View recipe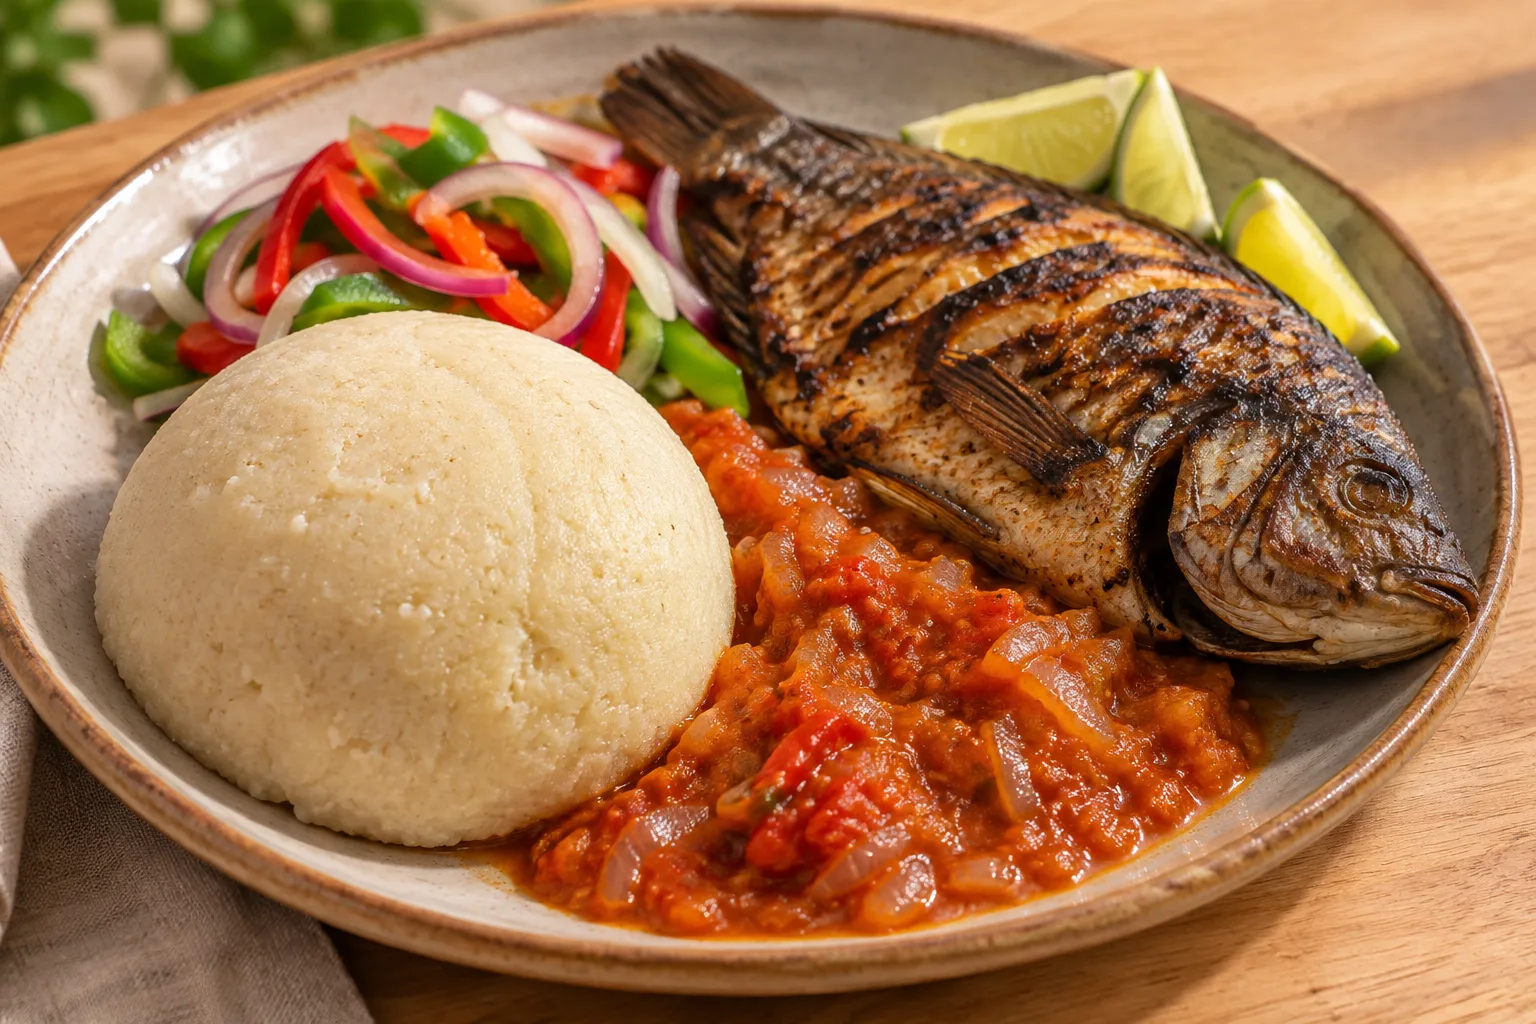
Banku with grilled tilapia
Corn-and-cassava banku, cooked until soft and slightly tangy, served with roasted tilapia, chile sauce, and fresh vegetables.
View recipe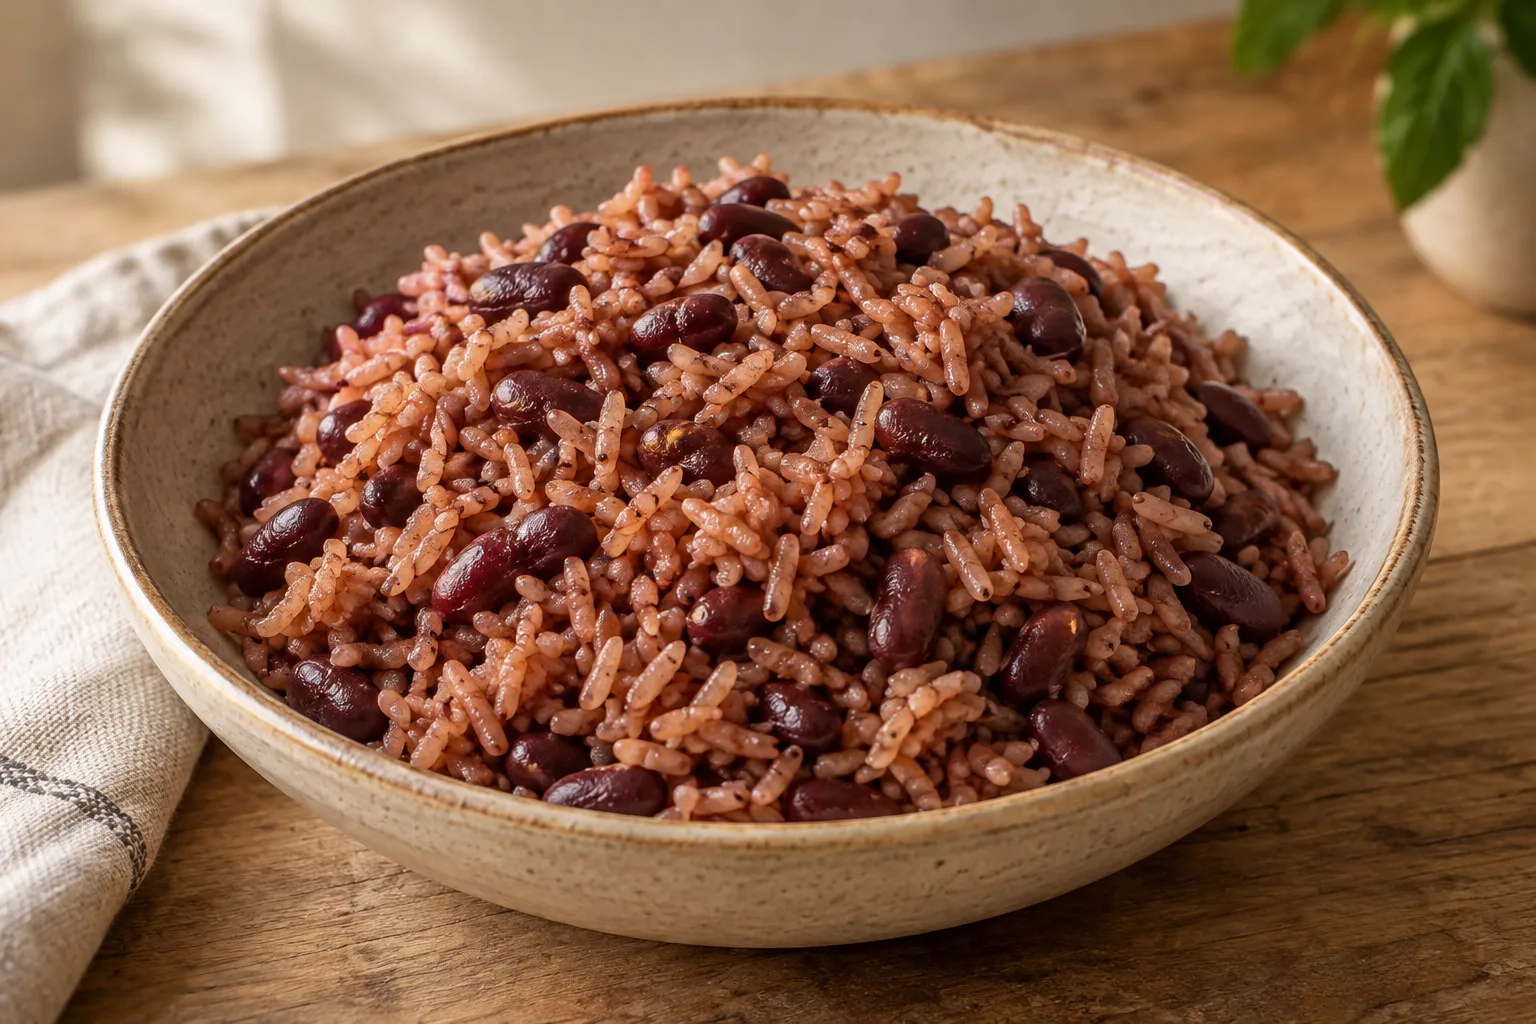
Ghanaian Waakye
Rice and beans cooked with an infusion of dried waakye leaves, which gives them their reddish color.
View recipe
Sources consulted
Read the sources and each document’s scope. A heritage inscription concerns a particular practice, not all of a country’s cuisine.
- Food consumption, nutrient intake, and dietary patterns in Ghanaian migrants in Europe and their compatriots in Ghana pmc.ncbi.nlm.nih.gov/articles/PMC5510194/ Food & Nutrition Research Consulted: November 2, 2026
- Dietary Patterns Are Associated with Predicted 10-Year Risk of Cardiovascular Disease Among Ghanaian Populations: the RODAM Study pmc.ncbi.nlm.nih.gov/articles/PMC6533550/ The Journal of Nutrition Consulted: November 2, 2026
- Salt and potassium intake among adult Ghanaians: WHO-SAGE Ghana Wave 3 pmc.ncbi.nlm.nih.gov/articles/PMC7523323/ BMC Nutrition Consulted: November 2, 2026
- Unhealthy eating practices of city-dwelling Africans in deprived neighbourhoods: Evidence for policy action from Ghana and Kenya pmc.ncbi.nlm.nih.gov/articles/PMC7726234/ Original research authors Consulted: November 2, 2026
- School feeding contributes to micronutrient adequacy of Ghanaian schoolchildren www.cambridge.org/core/journals/british-journal-of-nutrition/article/school-feeding-contribu… Original research authors Consulted: November 2, 2026
- Food-related behaviors of rural (Asaase Kooko) and peri-urban (Kaadjanor) households in Ghana www.frontiersin.org/journals/nutrition/articles/10.3389/fnut.2025.1523793/full Original research authors Consulted: November 2, 2026
- UNdata | record view | Cassava and products data.un.org/Data.aspx?d=FAO&f=itemCode%3A2532%3BcountryCode%3A81%3BelementCode%3A645 FAO / United Nations Statistics Division Consulted: November 2, 2026
- UNdata | record view | Yams data.un.org/Data.aspx?d=FAO&f=itemCode%3A2535%3BcountryCode%3A81%3BelementCode%3A645 FAO / United Nations Statistics Division Consulted: November 2, 2026
- UNdata | record view | Maize and products data.un.org/Data.aspx?d=FAO&f=itemCode%3A2514%3BcountryCode%3A81%3BelementCode%3A645 FAO / United Nations Statistics Division Consulted: November 2, 2026
- KitchenPause Ghana published recipe ingredient census www.kitchenpause.com/es/recetas?country=GH KitchenPause Consulted: November 2, 2026
- Ghana STEPS Report2023 — diet tables3.4.1 and3.4.2 www.afro.who.int/sites/default/files/2024-11/GHANA%20STEPS%20REPORT%202023.pdf Ghana Ministry of Health / Ghana Health Service / WHO Consulted: November 2, 2026
- UNdata | record view | Meat data.un.org/Data.aspx?d=FAO&f=itemCode%3A2943%3BcountryCode%3A81%3BelementCode%3A645 FAO / United Nations Statistics Division Consulted: November 2, 2026
- UNdata | record view | Fish, Seafood data.un.org/Data.aspx?d=FAO&f=itemCode%3A2960%3BcountryCode%3A81%3BelementCode%3A645 FAO / United Nations Statistics Division Consulted: November 2, 2026
- UNdata | record view | Eggs data.un.org/Data.aspx?d=FAO&f=itemCode%3A2949%3BcountryCode%3A81%3BelementCode%3A645 FAO / United Nations Statistics Division Consulted: November 2, 2026
- UNdata | record view | Milk - Excluding Butter data.un.org/Data.aspx?d=FAO&f=itemCode%3A2948%3BcountryCode%3A81%3BelementCode%3A645 FAO / United Nations Statistics Division Consulted: November 2, 2026
- UNdata | record view | Animal fats data.un.org/Data.aspx?d=FAO&f=itemCode%3A2946%3BcountryCode%3A81%3BelementCode%3A645 FAO / United Nations Statistics Division Consulted: November 2, 2026
- UNdata | record view | Palm Oil data.un.org/Data.aspx?d=FAO&f=itemCode%3A2577%3BcountryCode%3A81%3BelementCode%3A645 FAO / United Nations Statistics Division Consulted: November 2, 2026
- UNdata | record view | Coconut Oil data.un.org/Data.aspx?d=FAO&f=itemCode%3A2578%3BcountryCode%3A81%3BelementCode%3A645 FAO / United Nations Statistics Division Consulted: November 2, 2026
- Food and Nutrition for Senior High Schools — Teacher Manual, Year Two curriculumresources.edu.gh/wp-content/uploads/2026/06/FOOD-AND-NUTRITION-Teacher-Manual-Y2.p… Ministry of Education, Republic of Ghana / NaCCA Consulted: November 2, 2026
- Dietary diversity, eating habits, dietary patterns, food choice, and associated factors among adolescent girls: a convergent parallel mixed-method study in the Mion District of Ghana pmc.ncbi.nlm.nih.gov/articles/PMC11955308/ Journal of Nutritional Science / Cambridge University Press Consulted: November 2, 2026
- Ghana Demographic and Health Survey 2022 — Final Report www.dhsprogram.com/pubs/pdf/FR387/FR387.pdf Ghana Statistical Service / The DHS Program Consulted: November 2, 2026
- Ghana Living Standards Survey Round7: Main Report, Tables10.4–10.6 statsghana.gov.gh/api/minio/file?key=publications%2Fsurvey%2FGLSS%2FGLSS%207%20Main%20Report… Ghana Statistical Service Consulted: November 2, 2026
- Nutritionally Optimized, Culturally Acceptable, Cost-Minimized Diets for Low Income Ghanaian Families Using Linear Programming pmc.ncbi.nlm.nih.gov/articles/PMC5946246/ Nutrients Consulted: November 2, 2026
- Hallmark Café official menu, file labelled August2025, printedPage6 hallmarkcafegh.com/wp-content/uploads/2025/08/Hallmarkcafe-Menu-August_2025.pdf Hallmark Café Consulted: November 2, 2026
- Hallmark Café official attachment2530: publication date of the August2025menu hallmarkcafegh.com/wp-json/wp/v2/media/2530 Hallmark Café Consulted: November 2, 2026
- Determinants of Household-Level Food Storage Practices and Outcomes on Food Safety and Security in Accra, Ghana pmc.ncbi.nlm.nih.gov/articles/PMC9601939/ Foods Consulted: November 2, 2026
- Food Waste Index Report2024: Ghana Table15 and methodology appendix brasil.un.org/sites/default/files/2024-03/food_waste_index_report_2024_0.pdf UNEP Consulted: November 2, 2026
- Municipal solid waste characterization and quantification as a measure towards effective waste management in Ghana backend.orbit.dtu.dk/ws/files/118308088/1_s2.0_S0956053X15301185_main.pdf Waste Management / DTU public repository Consulted: November 2, 2026
- Fruit Processing in Ghana: an analysis, September2020, Methods and seasonal supply www.hortifresh.org/wp-content/uploads/FruitProcessingGhana_2021_online.pdf HortiFresh; Pamela Okyere and Hilarion Nyarko Consulted: November 2, 2026
- Homowo Festival | August/September ghanaculture.gov.gh/homowo-festival-august-september/ National Commission on Culture, Ghana Consulted: November 2, 2026
- Homowo Festival: Ga food and varying community calendars visitghana.com/homowo-festival/ Ghana Tourism Authority Consulted: November 2, 2026
- Millet kenkey: una nueva variante gna.org.gh/2024/03/millet-kenkey-the-new-variant-for-kenkey-lovers/ Ghana News Agency
- Cocinas de Ghana: granja, bosque, costa y sabana ghanaculture.gov.gh/from-farm-forest-coast-and-savannah-the-cultural-foundations-of-ghanaian… National Commission on Culture, Ghana