Food and eating habits
How people eat in United States
50 indicators exploring everyday meals, ingredients and food culture. Information is completed progressively from documented evidence.
50 of 50 indicators with documented information
Not all data are comparable: food supply, purchases and intake are different measures. Check the period, population and method for each finding. Qualitative descriptions do not establish percentages or amounts.
Timing and company
8/8
| Indicator | Findings and context |
|---|---|
| Meal times |
Peak periods for eating and drinking as a primary activity are noon to 12:59 and 6:00 to 6:59 in the evening, in local time. Scope, method and limitations
|
| Meals per day |
Mean of 5.7 eating occasions per day. Scope, method and limitations
|
| Meal duration |
Mean daily time: 66.2 minutes eating and drinking as a primary activity and 16.4 eating alongside another primary activity. Scope, method and limitations
|
| Daily energy distribution |
Among breakfast consumers, breakfast supplied a mean 21% of daily energy. Among all adults, breakfast supplied 18% of daily energy, lunch 23%, dinner 36% and snacks 23%. Scope, method and limitations
|
| Weekdays and weekends |
Mean of 2.6 eating occasions on weekend days versus 2.8 on weekdays. Scope, method and limitations
|
| Eating at home and away |
One’s own home or yard leads the listed places for primary eating and drinking, followed by the workplace and restaurants or bars. Scope, method and limitations
|
| Cooking frequency |
Home-cooked dinners: 8% reported never or almost never, 43% sometimes and 49% always, using the study categories. Scope, method and limitations
|
| Eating together |
Approximately 26% reported eating all their meals alone the previous day. Scope, method and limitations
|
Pantry and recipes
2/2
| Indicator | Findings and context |
|---|---|
| Most consumed ingredients |
Among cereal products, annual availability was 132.9 pounds of wheat flour and 35.5 pounds of corn products per person. Scope, method and limitations
|
| Ingredient prevalence in recipes |
In the U.S. sample profile, additives, spices and vegetables have the largest fractions of ingredient occurrences. Scope, method and limitations
|
Cereals and plant foods
6/6
| Indicator | Findings and context |
|---|---|
| Cereals and cereal products |
Grains: 6.19 ounce equivalents per person per day; whole grains 0.82 and refined grains 5.37. Scope, method and limitations
|
| Bread |
Bread, rolls and tortillas were recorded among food categories consumed at breakfast. Scope, method and limitations
|
| Pulses |
Beans, peas and lentils: 0.12 cup equivalents per person per day. Scope, method and limitations
|
| Vegetables |
Vegetables: 1.32 cup equivalents per person per day. Scope, method and limitations
|
| Fruit |
Total fruit: 0.98 cup equivalents per person per day, including 0.21 from fruit juice. Scope, method and limitations
|
| Potatoes, roots and tubers |
Potatoes: 0.35 cup equivalents per person per day. Scope, method and limitations
|
Protein foods
5/5
| Indicator | Findings and context |
|---|---|
| Meat |
Meat: 1.30; poultry: 1.46; cured meat: 0.82 ounce equivalents per person per day. Scope, method and limitations
|
| Fish and seafood |
Seafood: 0.33 ounce equivalents per person per day in the low n-3 category and 0.16 in the high n-3 category. Scope, method and limitations
|
| Eggs |
Eggs: 0.63 ounce equivalents per person per day. Scope, method and limitations
|
| Milk and dairy products |
Dairy group: 1.43 cup equivalents per person per day; milk 0.59, cheese 0.78 and yogurt 0.06. Scope, method and limitations
|
| Protein sources |
Contribution to protein intake: mixed dishes 45.2% in females and 48.3% in males; protein foods 20.0% and 21.3%; grains 9.6% and 8.6%, respectively. Among subcategories, burgers and sandwiches, including tacos and burritos, supplied 20.1% of protein in females and 24.4% in males. Meat, poultry and seafood mixed dishes supplied 10.0% and 9.1%, and rice, pasta and other grain-based mixed dishes 8.2% and 7.6%, respectively. Scope, method and limitations
|
Fats, flavours and condiments
3/3
| Indicator | Findings and context |
|---|---|
| Cooking fats |
Oils: mean 31.38 g per person per day; solid fats:33.02 g. Scope, method and limitations
|
| Herbs and spices |
A local survey recorded reported consumption of garlic powder, basil, oregano, chili powder and paprika. Scope, method and limitations
|
| Sauces and condiments |
Reported having at home: ketchup 84%, peanut butter 83%, mayonnaise 77% and mustard 75%. Scope, method and limitations
|
Meal composition
6/6
| Indicator | Findings and context |
|---|---|
| Breakfast composition |
85% reported breakfast on the intake day; grain products, eggs and coffee were recorded. Scope, method and limitations
|
| Main meal composition |
Among those reporting lunch,66% had mixed dishes and 33% sandwiches. Scope, method and limitations
|
| Dinner composition |
Among dinner consumers,67% had mixed dishes and 41% vegetables. Scope, method and limitations
|
| Appetisers and snacks |
95% reported food or drink in an occasion classified as a snack on the intake day. Scope, method and limitations
|
| Desserts and sweets |
Cookies and brownies, ice cream and frozen dairy desserts appear among sweets recorded at snacks. Scope, method and limitations
|
| Portion sizes |
Cooked rice: mean 150 g per eating occasion and median 131 g among consumers. Scope, method and limitations
|
Techniques and equipment
5/5
| Indicator | Findings and context |
|---|---|
| Cooking techniques |
In the surveyed homes, sautéing was the most used method, followed by boiling, baking, other methods, grilling and deep frying. Scope, method and limitations
|
| Vegetable preparation |
At lunch, 7% of lunch consumers had French fries or other fried potatoes. Scope, method and limitations
|
| Food preservation |
22% of interviewed adults reported home canning during the 2004 canning season. Scope, method and limitations
|
| Fermented foods |
U.S. preservation guidance includes sauerkraut and fermented dill pickles, distinguishing them from quick-process vinegar-acidified pickles without fermentation. Scope, method and limitations
|
| Kitchen equipment |
89% of U.S. households had a range combining a cooktop and oven. Scope, method and limitations
|
Drinks
3/3
| Indicator | Findings and context |
|---|---|
| Everyday drinks |
Mean individual shares of nonalcoholic beverage weight were: water 57.3%, coffee and tea 20.1%, sweetened beverages 11.2%, diet beverages 4.8%, milk 4.6% and one-hundred-percent juice 2.0%. Scope, method and limitations
|
| Coffee and tea preparation |
Among past-day coffee drinkers, 38% reported drip-brewed coffee, 23% single-cup brewing, 17% cold brewing and 11% an espresso machine. Scope, method and limitations
|
| Drinks with meals |
Among breakfast consumers, 48% had coffee, 26% water and 9% tea at that meal. At lunch, 32% had water, 18% sweetened beverages and 10% tea. At dinner, 31% had water, 17% sweetened beverages, 9% tea and 13% alcoholic beverages. At snacks, 75% had water, 21% coffee, 17% sweetened beverages and 13% tea. Scope, method and limitations
|
Nutrition and dietary patterns
3/3
| Indicator | Findings and context |
|---|---|
| Energy and nutrients |
Mean daily intake: energy 1999 kcal; protein 74.1 g; total fat 83.3 g; carbohydrate 231 g; dietary fiber 15.9 g. Scope, method and limitations
|
| Salt and sugars |
Daily means: sodium 3113 mg; total sugars 98 g; added sugars 14.71 teaspoon equivalents. Scope, method and limitations
|
| Dietary patterns |
5% considered themselves vegetarian and 2% vegan in two questions about their eating preferences. Scope, method and limitations
|
Shopping, prices and waste
7/7
| Indicator | Findings and context |
|---|---|
| Food expenditure |
Mean annual food expenditure: 10633 USD per consumer unit, comprising 6491 USD for food at home and 4142 USD away from home; food represents 13.0% of total expenditure. Scope, method and limitations
|
| Cost of a common basket |
The specified holiday cookout basket for 10 guests cost 73.82 USD. Scope, method and limitations
|
| Cost of specific meals |
Chicken Pot Tots: 1.61 USD per serving; the recipe declares 8 servings and a 301 g serving. Scope, method and limitations
|
| Grocery shopping locations |
Shares of food-acquisition transaction expenditure: 55% at large grocery stores, 3% at small or specialty stores and 7% at other food-at-home stores. Scope, method and limitations
|
| Shopping frequency |
2.81 weekly acquisitions at large grocery stores among households with at least one acquisition there. Scope, method and limitations
|
| Prepared food and delivery |
5.44 weekly acquisitions from restaurants and other eating places among households with at least one acquisition in that category. Scope, method and limitations
|
| Household food waste |
Published household estimate: 73 kg of food waste per person per year, including associated inedible parts. Scope, method and limitations
|
Seasons and celebrations
2/2
| Indicator | Findings and context |
|---|---|
| Seasonal produce |
Northwest Indiana harvest windows: cucumbers July 15–September 15; tomatoes July 15–October 15; apples July 15–November 1; grapes July 1–October 1. Scope, method and limitations
|
| Celebration food |
Independence Day, July 4: a festive menu documented in 2026 includes ground beef, chicken breasts and pork chops. Thanksgiving falls on the fourth Thursday in November; its nineteenth-century food history links turkey, cranberries and pumpkin pie. Scope, method and limitations
|
Coverage in progress
The editorial guide for this country is in preparation. You can already explore its recipes; regional attributions are added when documented.
Guide available in other languages: Español
Places and communities
One country, many cuisines
An initial selection of regions to explore. Culinary boundaries may differ from administrative divisions.
Cook
Recipes connected with United States
Each recipe documents one version. Geographic associations do not imply an exclusive origin.
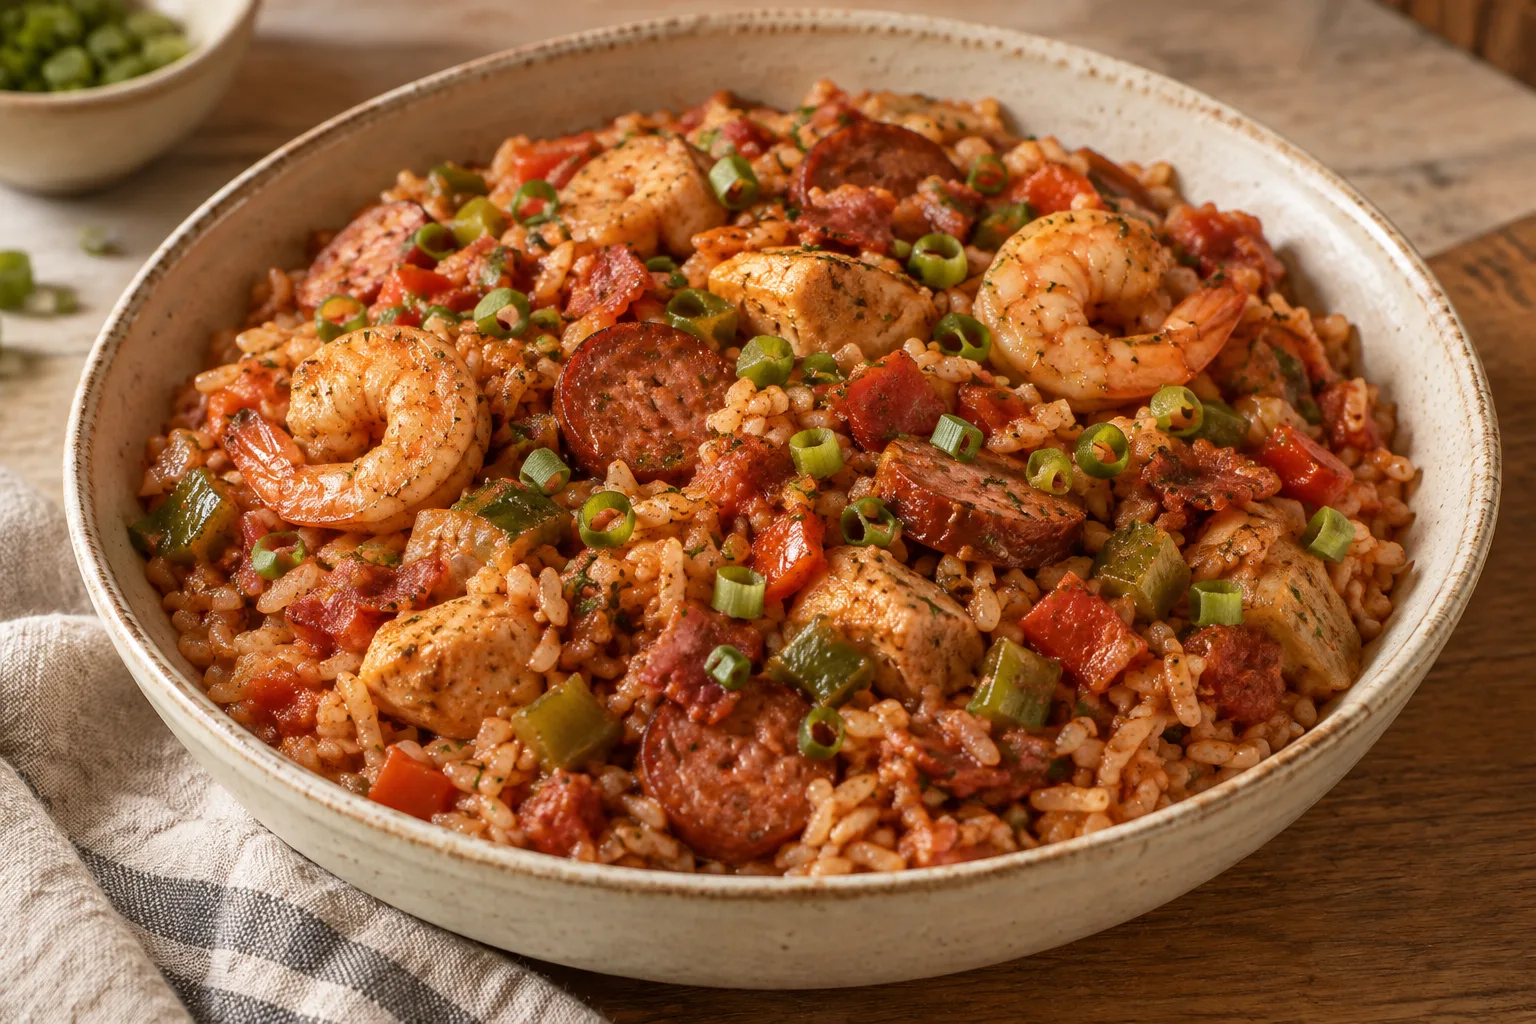
Louisiana Creole Jambalaya with Chicken, Smoked Sausage, and Shrimp
Louisiana rice cooked in one pot with chicken, smoked sausage, shrimp, the onion, celery, and pepper trinity, tomato, and spices. This Creole version includes tomato.
View recipe
Sources consulted
Read the sources and each document’s scope. A heritage inscription concerns a particular practice, not all of a country’s cuisine.
- Eating and Health Module2023 summary www.ers.usda.gov/data-products/eating-and-health-module-atus/summary-findings USDA Economic Research Service Consulted: November 4, 2026
- Frequency and Time of Day That Americans Eat, TB1954 ers.usda.gov/sites/default/files/_laserfiche/publications/93514/TB-1954.pdf?v=67871 USDA Economic Research Service Consulted: November 4, 2026
- Breakfast Consumption by U.S. Adults2017–March2020 www.ars.usda.gov/ARSUserFiles/80400530/pdf/DBrief/59_Breakfast_Consumption_by_Adults_1720.pd… USDA Agricultural Research Service Consulted: November 4, 2026
- Lunch Consumption by U.S.Adults,2017–March2020 www.ars.usda.gov/ARSUserFiles/80400530/pdf/DBrief/57_Lunch_Consumption_by_Adults_1720.pdf USDA Agricultural Research Service Consulted: November 4, 2026
- Dinner Consumption by U.S.Adults,2017–March2020 www.ars.usda.gov/ARSUserFiles/80400530/pdf/DBrief/55_Dinner_Consumption_by_Adults_1720.pdf USDA Agricultural Research Service Consulted: November 4, 2026
- Snack Consumption by U.S.Adults,2017–March2020 www.ars.usda.gov/ARSUserFiles/80400530/pdf/DBrief/53_Snacks_Consumption_by_Adults_1720.pdf USDA Agricultural Research Service Consulted: November 4, 2026
- Prevalence and patterns of cooking dinner at home, NHANES2007–2008 www.cambridge.org/core/services/aop-cambridge-core/content/view/56FAF38A1200B8B90AB23864B03D… Virudachalam et al., Public Health Nutrition Consulted: November 4, 2026
- Sharing meals is associated with greater wellbeing www.nature.com/articles/s41598-026-46771-9 Scientific Reports Consulted: November 4, 2026
- Food Availability and Consumption: cereal products2022 www.ers.usda.gov/data-products/ag-and-food-statistics-charting-the-essentials/food-availabil… USDA Economic Research Service Consulted: November 4, 2026
- The networks of ingredient combinations as culinary fingerprints of world cuisines pmc.ncbi.nlm.nih.gov/articles/PMC12635264/ Caprioli et al., npj Science of Food Consulted: November 4, 2026
- Food Patterns Equivalents Intakes, by Male/Female and Age, August 2021–August 2023 www.ars.usda.gov/ARSUserFiles/80400530/pdf/fped/Table_1_FPED_MaleFemale_2123.pdf USDA Agricultural Research Service Consulted: November 4, 2026
- Federal Data Analysis Report: Current Intakes of Nutrients and Dietary Components www.dietaryguidelines.gov/sites/default/files/2024-12/DA_Report_Current_Intakes_of_Nutrients… USDA/HHS Federal Data Analysis Team Consulted: November 4, 2026
- Food Category Sources of Dietary Protein, supplemental tables19.19a and19.20a www.dietaryguidelines.gov/sites/default/files/2024-12/DA_Supplement_Food_Category_Sources_Di… USDA/HHS Federal Data Analysis Team Consulted: November 4, 2026
- Food Category Sources Analysis Methodology, 2025 DGAC supplementary data analysis www.dietaryguidelines.gov/sites/default/files/2024-12/DA_Supplement_Food_Category_Sources_Me… USDA/HHS Federal Data Analysis Team and Mathematica Consulted: November 4, 2026
- Assessing Dietary Consumption of Toxicant-Laden Foods and Beverages by Age and Ethnicity in California: Implications for Proposition65 pmc.ncbi.nlm.nih.gov/articles/PMC12525620/ Nutrients, original research, doi10.3390/nu17193149 Consulted: November 4, 2026
- YouGov Survey: Condiments, January30–February1,2026 ygo-assets-websites-editorial-emea.yougov.net/documents/Condiments_poll_results.pdf YouGov Consulted: November 4, 2026
- Foods Commonly Eaten in the United States: Quantities Consumed per Eating Occasion and in a Day,1994–1996 www.ars.usda.gov/ARSUserFiles/80400530/pdf/Portion.pdf USDA Agricultural Research Service Consulted: November 4, 2026
- Residential Cooking Behavior in the United States: Data Collected from a Web-Based Survey www.osti.gov/servlets/purl/1242417 Lawrence Berkeley National Laboratory / U.S. Department of Energy Consulted: November 4, 2026
- Survey of Home Canning Practices and Safety Issues in the U.S. nchfp.uga.edu/papers/2007/canning_survey.html National Center for Home Food Preservation, University of Georgia Consulted: November 4, 2026
- General Information on Fermenting nchfp.uga.edu/how/ferment/general-information-on-ferment/general-information-on-fermenting/ National Center for Home Food Preservation / USDA Consulted: November 4, 2026
- In 2020, most U.S. households prepared at least one hot meal a day at home www.eia.gov/TodayinEnergy/detail.php?id=53439 U.S. Energy Information Administration Consulted: November 4, 2026
- Nonalcoholic Beverage Consumption Among Youth and Adults: United States, August 2021–August 2023. NCHS Data Brief 568, September 2026 portugues.cdc.gov/nchs/products/databriefs/db568.htm CDC / National Center for Health Statistics Consulted: November 4, 2026
- Fall 2025 National Coffee Data Trends: Grounds for celebration www.ncausa.org/Newsroom/Grounds-for-celebration-Americans-remain-committed-to-coffee National Coffee Association / Dig Insights Consulted: November 4, 2026
- Nutrient Intakes from Food and Beverages: Mean Amounts Consumed per Individual, by Male/Female and Age, August 2021–August 2023 www.ars.usda.gov/ARSUserFiles/80400530/pdf/2123/Table_1_NIN_MaleFemale_2123.pdf USDA Agricultural Research Service Consulted: November 4, 2026
- Gallup Poll Social Series: Consumption Habits, July 1–19, 2026, Final Topline news.gallup.com/file/poll/713663/2026_08_Lifestyle%20Topline%20and%20Tabs.pdf Gallup Consulted: November 4, 2026
- Consumer Expenditures Summary, 2025 www.bls.gov/news.release/cesan.nr0.htm U.S. Bureau of Labor Statistics Consulted: November 4, 2026
- Cost of Fourth of July Cookout Reflects Inflation Increase, June 24, 2026 www.fb.org/news-release/cost-of-fourth-of-july-cookout-reflects-inflation-increase American Farm Bureau Federation Consulted: November 4, 2026
- Choose Homemade Recipes: 2025 ONIE Calendar onieproject.org/wp-content/uploads/2024/11/2025-ONIE-Calandar-Web-1.pdf ONIE Project Consulted: November 4, 2026
- Food Waste Index Report 2024 brasil.un.org/sites/default/files/2024-03/food_waste_index_report_2024.pdf United Nations Environment Programme Consulted: November 4, 2026
- 2019 Wasted Food Report www.epa.gov/system/files/documents/2024-04/2019-wasted-food-report_508_opt_ec_4.23correction… U.S. Environmental Protection Agency Consulted: November 4, 2026
- Where Households Get Food in a Typical Week: Findings From USDA’s FoodAPS, EIB-156 www.ers.usda.gov/sites/default/files/_laserfiche/publications/80542/EIB-156.pdf?v=26837 USDA Economic Research Service Consulted: November 4, 2026
- Indiana Seasonal Crop Calendar: Northwest Indiana, Crop Area 1 www.in.gov/dwd/job-seekers/migrant-and-seasonal-farm-worker/ Indiana Department of Workforce Development Consulted: November 4, 2026
- What are Federal holidays? www.opm.gov/frequently-asked-questions/pay-and-leave-faq/pay-administration/what-are-federal… U.S. Office of Personnel Management Consulted: November 4, 2026
- Traditional Thanksgiving Cooking www.nps.gov/articles/000/traditional-thanksgiving-cooking.htm U.S. National Park Service Consulted: November 4, 2026
- Luisiana y sus tradiciones www.visittheusa.com/destinations/louisiana/ Brand USA — Visit The USA
- Massachusetts: productos y cocinas del Atlántico www.visittheusa.com/destinations/massachusetts/ Brand USA — Visit The USA
- Nuevo México: cocinas y culturas traveltrade.visittheusa.com/destinations/new-mexico/ Brand USA — Visit The USA