Americas · Northern America

United States

Recipes connected with United States

Food and eating habits

How people eat in United States

50 indicators exploring everyday meals, ingredients and food culture. Information is completed progressively from documented evidence.

50 of 50 indicators with documented information

Not all data are comparable: food supply, purchases and intake are different measures. Check the period, population and method for each finding. Qualitative descriptions do not establish percentages or amounts.

Timing and company

8/8
Timing and company — United States
IndicatorFindings and context
Meal times
Quantitative findingSurvey

Peak periods for eating and drinking as a primary activity are noon to 12:59 and 6:00 to 6:59 in the evening, in local time.

Scope, method and limitations
Observation period
2023
Unit
local clock time
Population or sample
U.S. population aged fifteen and older.
Geographic scope
ATUS summary for 2023.
Definition and method
National time-use survey; previous-day diary and survey weights.
Comparison limitations
Peaks by hourly interval, not mean lunch or dinner start times; not all meals are covered.
Meals per day
Quantitative findingSurvey

Mean of 5.7 eating occasions per day.

Scope, method and limitations
Observation period
2013-16
Unit
occasions/day
Population or sample
U.S. adults aged eighteen and older.
Geographic scope
NHANES 2013–16, first dietary recall; official analysis table.
Definition and method
Multiple-pass recall and weighted estimate of eating occasions.
Comparison limitations
Includes drinks, snacks and extended consumption; not five main meals and not interchangeable with ATUS primary-activity episodes.
Meal duration
Quantitative findingSurvey

Mean daily time: 66.2 minutes eating and drinking as a primary activity and 16.4 eating alongside another primary activity.

Scope, method and limitations
Observation period
2023
Unit
minutes/day
Population or sample
U.S. population aged fifteen and older.
Geographic scope
Average day in 2023.
Definition and method
National time-use survey; previous-day diary and survey weights.
Comparison limitations
Partial coverage: daily totals, not separate breakfast, lunch or dinner durations. Not divided by an assumed number of meals.
Daily energy distribution
Quantitative findingObserved intake

Among breakfast consumers, breakfast supplied a mean 21% of daily energy. Among all adults, breakfast supplied 18% of daily energy, lunch 23%, dinner 36% and snacks 23%.

Scope, method and limitations
Observation period
2017-2020
Unit
% of daily energy
Population or sample
7707 adults aged 20+; the 21% figure applies only to the 6343 breakfast consumers.
Geographic scope
WWEIA/NHANES, 2017 to March 2020.
Definition and method
First dietary recall, participant-defined breakfast and weighted estimates.
Comparison limitations
All-adult and consumer figures have different denominators and are not combined. Historical one-day observation, without inferring habits or recommendations.
Weekdays and weekends
Quantitative findingSurvey

Mean of 2.6 eating occasions on weekend days versus 2.8 on weekdays.

Scope, method and limitations
Observation period
2014-16
Unit
occasions/day
Population or sample
U.S. adults aged eighteen and older.
Geographic scope
ATUS-EHM 2014–16; report-defined day categories.
Definition and method
Activity diary and secondary-eating module, with weighted means.
Comparison limitations
Not main meals only; not compared with NHANES counts. Does not describe changes in timing, composition or energy.
Eating at home and away
Qualitative descriptionSurvey

One’s own home or yard leads the listed places for primary eating and drinking, followed by the workplace and restaurants or bars.

Scope, method and limitations
Observation period
2023
Population or sample
U.S. population aged fifteen and older.
Geographic scope
Places listed in the 2023 national summary.
Definition and method
National time-use survey; previous-day diary and survey weights.
Comparison limitations
Partial qualitative coverage of the ordering of places. No percentages by meal or equivalence between location and preparation origin.
Cooking frequency
Quantitative findingSurvey

Home-cooked dinners: 8% reported never or almost never, 43% sometimes and 49% always, using the study categories.

Scope, method and limitations
Observation period
2007-2008
Unit
%
Population or sample
Households in an NHANES sample of 10149 participants of all ages; 9993 valid responses in the frequency table, representing the civilian non-institutionalized population.
Geographic scope
NHANES 2007–2008, recalling the preceding seven days.
Definition and method
In-person question answered by a household reference person about dinners cooked by them or a family member; weighted estimates accounting for NHANES strata and clusters.
Comparison limitations
Historical household coverage, not personal cooking or breakfast and lunch. Includes assembling ingredients and excludes reheating leftovers; labels are study-specific.
Eating together
Quantitative findingSurvey

Approximately 26% reported eating all their meals alone the previous day.

Scope, method and limitations
Observation period
2023
Unit
%
Population or sample
Participants in the U.S. ATUS analysis; primary eating and drinking episodes.
Geographic scope
Weighted estimate for 2023.
Definition and method
The study identifies company during diary episodes; all-day solo eating is a person-level indicator.
Comparison limitations
Not the share of meals eaten alone or a measure of emotional loneliness. Excludes secondary eating and does not establish causal effects on wellbeing.

Pantry and recipes

2/2
Pantry and recipes — United States
IndicatorFindings and context
Most consumed ingredients
Quantitative findingFood supply

Among cereal products, annual availability was 132.9 pounds of wheat flour and 35.5 pounds of corn products per person.

Scope, method and limitations
Observation period
2022
Unit
pounds/person/year
Population or sample
U.S. population; per-capita averages derived from the food supply.
Geographic scope
Food availability in 2022; corn products include flour and meal, hominy and grits, and food starch.
Definition and method
Food-system balances divided by population, as calculated by the official source; original units retained.
Comparison limitations
Partial coverage of cereal products, not a ranking of all foods or measured intake. No conversion to kilograms or equation of availability with purchases or eating.
Ingredient prevalence in recipes
Qualitative descriptionRecipe sample

In the U.S. sample profile, additives, spices and vegetables have the largest fractions of ingredient occurrences.

Scope, method and limitations
Population or sample
Corpus labelled “American”: 16056 recipes; the label denotes the United States, separately from Canada.
Geographic scope
Analysis published in 2025 using CulinaryDB; exact recipe collection dates are not specified.
Definition and method
Visual reading of the U.S. figure panel; category occurrences are normalised by the sum of recipe ingredient counts. Similar ingredient names and forms are consolidated.
Comparison limitations
Partial qualitative category coverage: not percentages of recipes per ingredient, quantities eaten or national preferences. No numeric bar values are estimated or independent dish deduplication established.

Cereals and plant foods

6/6
Cereals and plant foods — United States
IndicatorFindings and context
Cereals and cereal products
Quantitative findingObserved intake

Grains: 6.19 ounce equivalents per person per day; whole grains 0.82 and refined grains 5.37.

Scope, method and limitations
Observation period
August 2021–August 2023
Unit
ounce equivalents/person/day
Population or sample
U.S. population aged 2 years and over; sample of 6563 individuals, excluding breast-fed children.
Geographic scope
Mean daily intake, August 2021–August 2023; FPED food-pattern equivalents.
Definition and method
Weighted first-day WWEIA/NHANES dietary intake; original table units retained.
Comparison limitations
Survey mean, not individual usual intake, purchases or availability. No conversion to grams or interpretation as dry or cooked weight. Partial coverage: aggregate groups, without amounts by cereal species.
Bread
Qualitative descriptionObserved intake

Bread, rolls and tortillas were recorded among food categories consumed at breakfast.

Scope, method and limitations
Population or sample
U.S. adults aged 20 years and over.
Geographic scope
Self-reported breakfasts in WWEIA/NHANES 2017–March 2020.
Definition and method
Reading of the food category in the breakfast table, using first-day dietary intake data.
Comparison limitations
Partial qualitative coverage of breakfast; not all breads, their ingredients or daily consumption.
Pulses
Quantitative findingObserved intake

Beans, peas and lentils: 0.12 cup equivalents per person per day.

Scope, method and limitations
Observation period
August 2021–August 2023
Unit
cup equivalents/person/day
Population or sample
U.S. population aged 2 years and over; sample of 6563 individuals, excluding breast-fed children.
Geographic scope
Mean daily intake, August 2021–August 2023; FPED food-pattern equivalents.
Definition and method
Weighted first-day WWEIA/NHANES dietary intake; original table units retained.
Comparison limitations
Survey mean, not individual usual intake, purchases or availability. No conversion to grams or interpretation as dry or cooked weight. Partial coverage: joint category excluded from total vegetables and total protein foods in these tables; do not add alternative equivalents.
Vegetables
Quantitative findingObserved intake

Vegetables: 1.32 cup equivalents per person per day.

Scope, method and limitations
Observation period
August 2021–August 2023
Unit
cup equivalents/person/day
Population or sample
U.S. population aged 2 years and over; sample of 6563 individuals, excluding breast-fed children.
Geographic scope
Mean daily intake, August 2021–August 2023; FPED food-pattern equivalents.
Definition and method
Weighted first-day WWEIA/NHANES dietary intake; original table units retained.
Comparison limitations
Survey mean, not individual usual intake, purchases or availability. No conversion to grams or interpretation as dry or cooked weight. Partial coverage: total includes potatoes and excludes beans, peas and lentils; no species ranking.
Fruit
Quantitative findingObserved intake

Total fruit: 0.98 cup equivalents per person per day, including 0.21 from fruit juice.

Scope, method and limitations
Observation period
August 2021–August 2023
Unit
cup equivalents/person/day
Population or sample
U.S. population aged 2 years and over; sample of 6563 individuals, excluding breast-fed children.
Geographic scope
Mean daily intake, August 2021–August 2023; FPED food-pattern equivalents.
Definition and method
Weighted first-day WWEIA/NHANES dietary intake; original table units retained.
Comparison limitations
Survey mean, not individual usual intake, purchases or availability. No conversion to grams or interpretation as dry or cooked weight. Partial coverage: includes juice, not whole fruit alone; no breakdown for every species.
Potatoes, roots and tubers
Quantitative findingObserved intake

Potatoes: 0.35 cup equivalents per person per day.

Scope, method and limitations
Observation period
August 2021–August 2023
Unit
cup equivalents/person/day
Population or sample
U.S. population aged 2 years and over; sample of 6563 individuals, excluding breast-fed children.
Geographic scope
Mean daily intake, August 2021–August 2023; FPED food-pattern equivalents.
Definition and method
Weighted first-day WWEIA/NHANES dietary intake; original table units retained.
Comparison limitations
Survey mean, not individual usual intake, purchases or availability. No conversion to grams or interpretation as dry or cooked weight. Partial coverage: potatoes only, already included in vegetables; not all tubers or separate preparations.

Protein foods

5/5
Protein foods — United States
IndicatorFindings and context
Meat
Quantitative findingObserved intake

Meat: 1.30; poultry: 1.46; cured meat: 0.82 ounce equivalents per person per day.

Scope, method and limitations
Observation period
August 2021–August 2023
Unit
ounce equivalents/person/day
Population or sample
U.S. population aged 2 years and over; sample of 6563 individuals, excluding breast-fed children.
Geographic scope
Mean daily intake, August 2021–August 2023; FPED food-pattern equivalents.
Definition and method
Weighted first-day WWEIA/NHANES dietary intake; original table units retained.
Comparison limitations
Partial coverage of the table categories, without an all-meat total or breakdown by every species. These are intake equivalents, not carcass weight, purchases or grams of protein. No conversion to kilograms.
Fish and seafood
Quantitative findingObserved intake

Seafood: 0.33 ounce equivalents per person per day in the low n-3 category and 0.16 in the high n-3 category.

Scope, method and limitations
Observation period
August 2021–August 2023
Unit
ounce equivalents/person/day
Population or sample
U.S. population aged 2 years and over; sample of 6563 individuals, excluding breast-fed children.
Geographic scope
Mean daily intake, August 2021–August 2023; FPED food-pattern equivalents.
Definition and method
Weighted first-day WWEIA/NHANES dietary intake; original table units retained.
Comparison limitations
Partial coverage by n-3 categories, without species or fresh/preserved breakdown. Categories are not added or converted to grams of food or protein.
Eggs
Quantitative findingObserved intake

Eggs: 0.63 ounce equivalents per person per day.

Scope, method and limitations
Observation period
August 2021–August 2023
Unit
ounce equivalents/person/day
Population or sample
U.S. population aged 2 years and over; sample of 6563 individuals, excluding breast-fed children.
Geographic scope
Mean daily intake, August 2021–August 2023; FPED food-pattern equivalents.
Definition and method
Weighted first-day WWEIA/NHANES dietary intake; original table units retained.
Comparison limitations
Partial coverage in food equivalents; not egg counts or annual kilograms. No size or weight conversion is applied.
Milk and dairy products
Quantitative findingObserved intake

Dairy group: 1.43 cup equivalents per person per day; milk 0.59, cheese 0.78 and yogurt 0.06.

Scope, method and limitations
Observation period
August 2021–August 2023
Unit
cup equivalents/person/day
Population or sample
U.S. population aged 2 years and over; sample of 6563 individuals, excluding breast-fed children.
Geographic scope
Mean daily intake, August 2021–August 2023; FPED food-pattern equivalents.
Definition and method
Weighted first-day WWEIA/NHANES dietary intake; original table units retained.
Comparison limitations
Partial coverage of the FPED classification: milk and yogurt include their soy alternatives. Cheese cup equivalents are not physical cups of cheese or litres of milk. The entire group is not assigned to animal origin.
Protein sources
Quantitative findingObserved intake

Contribution to protein intake: mixed dishes 45.2% in females and 48.3% in males; protein foods 20.0% and 21.3%; grains 9.6% and 8.6%, respectively. Among subcategories, burgers and sandwiches, including tacos and burritos, supplied 20.1% of protein in females and 24.4% in males. Meat, poultry and seafood mixed dishes supplied 10.0% and 9.1%, and rice, pasta and other grain-based mixed dishes 8.2% and 7.6%, respectively.

Scope, method and limitations
Observation period
2011–March 2020
Unit
% of dietary protein
Population or sample
U.S. females and males aged 2 years and over; samples of 17704 females and 17598 males. Pregnant and lactating females and children consuming human milk are excluded.
Geographic scope
WWEIA/NHANES 2011–March 2020; percentages of dietary protein by food category, separately by sex.
Definition and method
Weighted first-day recall; the protein proportion supplied by each category is calculated for each person and then averaged with survey weights, using categories adapted from WWEIA.
Comparison limitations
Partial coverage of the leading categories, not a complete breakdown by ingredient or animal and plant protein. Mixed dishes retain their components together; not all their protein is assigned to meat or legumes. Infant formula, baby foods and the other category are excluded. Subcategories belong to the mixed dishes already counted and are not added to them. These are percentages of protein intake, not people, meals or recipes; they do not separate animal and plant protein.

Fats, flavours and condiments

3/3
Fats, flavours and condiments — United States
IndicatorFindings and context
Cooking fats
Quantitative findingObserved intake

Oils: mean 31.38 g per person per day; solid fats:33.02 g.

Scope, method and limitations
Observation period
August 2021–August 2023
Unit
g/person/day
Population or sample
U.S. population aged 2 years and over; sample of 6563 individuals, excluding breast-fed children.
Geographic scope
Mean daily intake, August 2021–August 2023; FPED food-pattern equivalents.
Definition and method
Weighted first-day WWEIA/NHANES dietary intake; original table units retained.
Comparison limitations
Partial coverage of intake classified by FPED, not amounts added during home cooking. No breakdown of olive oil, other oils or butter; not equivalent to total fat or saturated fat.
Herbs and spices
Qualitative descriptionSurvey

A local survey recorded reported consumption of garlic powder, basil, oregano, chili powder and paprika.

Scope, method and limitations
Population or sample
Adolescents and adults recruited by convenience sampling in Southern California.
Geographic scope
Survey from March 1 to June 15,2023, recalling consumption over the previous 7 days.
Definition and method
Online questionnaire circulated through community contacts and social media; identification of ingredients reported in the study table.
Comparison limitations
Partial qualitative coverage of a local sample. It establishes neither national prevalence nor percentages of recipes containing each ingredient.
Sauces and condiments
Quantitative findingSurvey

Reported having at home: ketchup 84%, peanut butter 83%, mayonnaise 77% and mustard 75%.

Scope, method and limitations
Observation period
January 30–February 1, 2026
Unit
% of adult citizen respondents
Population or sample
U.S. adult citizens;1104 respondents, target population aged 18 years and over.
Geographic scope
Survey January 30–February 1,2026; self-reported home availability.
Definition and method
Online interviews with an opt-in panel, with demographic and political weighting; multiple-response question.
Comparison limitations
Partial coverage using a broad definition of condiments including spreads. It does not measure intake, amounts purchased, ingredients or frequency of use. Responses overlap and must not be added.

Meal composition

6/6
Meal composition — United States
IndicatorFindings and context
Breakfast composition
Quantitative findingObserved intake

85% reported breakfast on the intake day; grain products, eggs and coffee were recorded.

Scope, method and limitations
Observation period
2017–March 2020
Unit
% of adults
Population or sample
U.S.adults aged 20 years and over; total sample 7707 individuals.
Geographic scope
WWEIA/NHANES 2017–March 2020; first day of reported dietary intake.
Definition and method
In-person 24-hour recall, multiple-pass method and national weighting. Meal classification follows the reported name, without inferring it from clock time.
Comparison limitations
Partial coverage of the observed day; not usual frequency or a required combination of these foods. Categories can coexist.
Main meal composition
Quantitative findingObserved intake

Among those reporting lunch,66% had mixed dishes and 33% sandwiches.

Scope, method and limitations
Observation period
2017–March 2020
Unit
% of lunch consumers
Population or sample
Lunch consumers aged 20+:5625 of the 7707 sampled adults.
Geographic scope
WWEIA/NHANES 2017–March 2020; first day of reported dietary intake.
Definition and method
In-person 24-hour recall, multiple-pass method and national weighting. Meal classification follows the reported name, without inferring it from clock time.
Comparison limitations
Partial lunch coverage, not identification of each person’s main meal or a course-by-course menu. Sandwiches are part of mixed dishes; do not add the categories.
Dinner composition
Quantitative findingObserved intake

Among dinner consumers,67% had mixed dishes and 41% vegetables.

Scope, method and limitations
Observation period
2017–March 2020
Unit
% of dinner consumers
Population or sample
Dinner consumers aged 20+:6914 of 7707 adults.
Geographic scope
WWEIA/NHANES 2017–March 2020; first day of reported dietary intake.
Definition and method
In-person 24-hour recall, multiple-pass method and national weighting. Meal classification follows the reported name, without inferring it from clock time.
Comparison limitations
Partial coverage of food categories, without grams per dish or a full cold/hot preparation breakdown. They can occur at the same dinner; do not add percentages.
Appetisers and snacks
Quantitative findingObserved intake

95% reported food or drink in an occasion classified as a snack on the intake day.

Scope, method and limitations
Observation period
2017–March 2020
Unit
% of adults
Population or sample
U.S.adults aged 20 years and over; total sample 7707 individuals.
Geographic scope
WWEIA/NHANES 2017–March 2020; first day of reported dietary intake.
Definition and method
In-person 24-hour recall, multiple-pass method and national weighting. Meal classification follows the reported name, without inferring it from clock time.
Comparison limitations
The definition includes drinks and reported extended consumption, not only solid food between meals. Not a daily habit estimate or each person’s snack count.
Desserts and sweets
Qualitative descriptionObserved intake

Cookies and brownies, ice cream and frozen dairy desserts appear among sweets recorded at snacks.

Scope, method and limitations
Population or sample
Snack consumers aged 20+ in the adult survey.
Geographic scope
WWEIA/NHANES 2017–March 2020; first day of reported dietary intake.
Definition and method
In-person 24-hour recall, multiple-pass method and national weighting. Meal classification follows the reported name, without inferring it from clock time.
Comparison limitations
Partial qualitative coverage of sweet snacks, without establishing service as dessert after a meal. No recipes, ingredient amounts or national after-meal dessert frequency.
Portion sizes
Quantitative findingObserved intake

Cooked rice: mean 150 g per eating occasion and median 131 g among consumers.

Scope, method and limitations
Observation period
January 1994–January 1997 (CSFII1994–1996)
Unit
g/consumer/eating occasion
Population or sample
Rice consumers aged 2+ within a national sample of 14262 non-breast-fed individuals.
Geographic scope
CSFII 1994–1996; interviews January 1994–January 1997. Category of cooked white and brown rice.
Definition and method
Two 24-hour recalls and weighted estimates; weights assigned to reported quantities using the food database. Relevant consumer reports per eating occasion are included.
Comparison limitations
Historical survey observation, not a recommended serving or current restaurant weight. Includes separate rice and rice in mainly rice-based dishes, excluding other ingredients’ weight; excludes wild rice, cream of rice, rice in puddings and soups.

Techniques and equipment

5/5
Techniques and equipment — United States
IndicatorFindings and context
Cooking techniques
Qualitative descriptionSurvey

In the surveyed homes, sautéing was the most used method, followed by boiling, baking, other methods, grilling and deep frying.

Scope, method and limitations
Population or sample
2171 completed responses from participants with U.S. homes in the total sample; methods use subsamples reporting that each meal was eaten at home.
Geographic scope
Web survey from July 15, 2012 to March 21, 2013 about the preceding 24 hours.
Definition and method
Voluntary participation recruited through networks and mailing lists. Method questions were addressed to those reporting that they ate that meal at home; subsamples vary by meal.
Comparison limitations
Historical, partial coverage: not demographically or geographically representative. The qualitative ranking gives neither current national frequencies nor coverage of every technique.
Vegetable preparation
Quantitative findingObserved intake

At lunch, 7% of lunch consumers had French fries or other fried potatoes.

Scope, method and limitations
Observation period
2017–March 2020
Unit
% of lunch consumers
Population or sample
Lunch consumers aged 20+: 5625 among the 7707 adults in the U.S. sample.
Geographic scope
WWEIA/NHANES 2017–March 2020; first day of reported intake.
Definition and method
In-person 24-hour recall with national weighting. Fried-potato category in the lunch food table; lunch is defined by the respondent.
Comparison limitations
Partial coverage of one preparation at one meal: not the percentage of vegetables that are fried or a raw/boiled/roasted partition. It identifies neither who cooked the food nor habitual consumption.
Food preservation
Quantitative findingSurvey

22% of interviewed adults reported home canning during the 2004 canning season.

Scope, method and limitations
Observation period
2004 (survey 2005)
Unit
% of interviewed adults
Population or sample
801 completed adult interviews in selected U.S. households; 174 respondents canned foods at home.
Geographic scope
2004 canning season, recalled in the survey from April 4 to June 16, 2005.
Definition and method
National telephone survey with random household selection and a 30% cooperation rate. The published percentage covers completed interviews.
Comparison limitations
Historical, partial coverage of canning: no quantification of freezing, drying, salting or present-day practices. Self-report is subject to recall and nonresponse; observed practices are not safety instructions.
Fermented foods
Qualitative descriptionCultural context

U.S. preservation guidance includes sauerkraut and fermented dill pickles, distinguishing them from quick-process vinegar-acidified pickles without fermentation.

Scope, method and limitations
Population or sample
Technical repertoire of U.S. home preservation; no consumer sample.
Geographic scope
USDA preservation guide revised in 2015 and adapted by the university home-preservation center.
Definition and method
Description of products and processes in guidance, without an intake or frequency survey.
Comparison limitations
Qualitative, partial coverage: no evidence of consumption frequency, household prevalence or national quantities. The process distinction is not a recipe or a substitute for a complete tested procedure.
Kitchen equipment
Quantitative findingSurvey

89% of U.S. households had a range combining a cooktop and oven.

Scope, method and limitations
Observation period
2020
Unit
% of households
Population or sample
U.S. households; 18496 households responded to RECS 2020.
Geographic scope
2020 reference; questionnaires collected in late 2020 and early 2021.
Definition and method
Residential energy survey using self-administered web or mail questionnaires; published national estimate of combined cooktop-and-oven ownership.
Comparison limitations
Partial equipment coverage: not the share owning any type of oven. Microwave, electric pressure-cooker or rice-cooker use is not converted to ownership; no exact ownership percentage for those appliances is given here.

Drinks

3/3
Drinks — United States
IndicatorFindings and context
Everyday drinks
Quantitative findingObserved intake

Mean individual shares of nonalcoholic beverage weight were: water 57.3%, coffee and tea 20.1%, sweetened beverages 11.2%, diet beverages 4.8%, milk 4.6% and one-hundred-percent juice 2.0%.

Scope, method and limitations
Observation period
August 2021–August 2023
Unit
% of individual nonalcoholic beverage grams, weighted mean
Population or sample
4790 adults aged 20+ in the civilian noninstitutionalized U.S. population who reported nonalcoholic beverage intake.
Geographic scope
NHANES, August 2021–August 2023; first dietary-recall day.
Definition and method
Telephone 24-hour recall and national weighting. Each participant’s category grams are divided by total included beverage grams, followed by the weighted mean.
Comparison limitations
Partial coverage excluding alcohol: not percentages of people, calories or liters. Milk includes plant substitutes, flavored varieties and milk added to cereal; juice includes fruit and vegetable juices. Comparisons with studies excluding these uses require matching definitions.
Coffee and tea preparation
Quantitative findingSurvey

Among past-day coffee drinkers, 38% reported drip-brewed coffee, 23% single-cup brewing, 17% cold brewing and 11% an espresso machine.

Scope, method and limitations
Observation period
June 2025
Unit
% of past-day coffee drinkers
Population or sample
U.S. adults reporting coffee on the previous day in the consumption survey; not all adults or households.
Geographic scope
June 2025 survey released in the Fall 2025 report.
Definition and method
Self-reported preparation methods for previous-day coffee; Dig Insights research for the industry association. The open summary does not specify the base size, recruitment or weighting here.
Comparison limitations
Partial coffee coverage, without tea methods, cup size or milk and sugar quantities. Responses may coexist; do not sum or interpret as machine ownership or cup shares. No volume conversion.
Drinks with meals
Quantitative findingObserved intake

Among breakfast consumers, 48% had coffee, 26% water and 9% tea at that meal. At lunch, 32% had water, 18% sweetened beverages and 10% tea. At dinner, 31% had water, 17% sweetened beverages, 9% tea and 13% alcoholic beverages. At snacks, 75% had water, 21% coffee, 17% sweetened beverages and 13% tea.

Scope, method and limitations
Observation period
2017–March 2020
Unit
% of consumers of the specified meal
Population or sample
7707 adults aged 20+: 6343 breakfast, 5625 lunch, 6914 dinner and 7106 snack consumers; occasion-specific denominators.
Geographic scope
WWEIA/NHANES 2017–March 2020; first reported intake day.
Definition and method
In-person 24-hour recall and national weighting. Respondent-defined breakfast; categories of beverages consumed on that occasion. Lunch also respondent-defined.
Comparison limitations
Drinks can coexist: do not add percentages or infer weight shares or habits. Snacks include drinks and extended consumption under the study definition; categories may include additions.

Nutrition and dietary patterns

3/3
Nutrition and dietary patterns — United States
IndicatorFindings and context
Energy and nutrients
Quantitative findingObserved intake

Mean daily intake: energy 1999 kcal; protein 74.1 g; total fat 83.3 g; carbohydrate 231 g; dietary fiber 15.9 g.

Scope, method and limitations
Observation period
August 2021–August 2023
Unit
kcal/person/day and g/person/day
Population or sample
6563 U.S. individuals aged 2+; both sexes, excluding breast-fed children.
Geographic scope
WWEIA/NHANES, August 2021–August 2023; first reported intake day.
Definition and method
Telephone 24-hour recall using the five-step method; nutrients calculated with FNDDS and means using national dietary weights.
Comparison limitations
Partial coverage of food and beverages, including water, without supplements or medications. Reported-day means, not recommendations, individual requirements or usual intake; excludes children under two and institutionalized people.
Salt and sugars
Quantitative findingObserved intake

Daily means: sodium 3113 mg; total sugars 98 g; added sugars 14.71 teaspoon equivalents.

Scope, method and limitations
Observation period
August 2021–August 2023
Unit
mg sodium/person/day; g total sugars/person/day; teaspoon equivalents added sugars/person/day
Population or sample
6563 U.S. individuals aged 2+, both sexes; excluding breast-fed children.
Geographic scope
WWEIA/NHANES, August 2021–August 2023; first-day nutrient and food-pattern-equivalent tables.
Definition and method
Telephone 24-hour recall, FNDDS coding for sodium and total sugars, and FPED for added sugars; nationally weighted estimates.
Comparison limitations
Partial coverage: sodium is not converted to salt, and added-sugar equivalents are not converted to grams. Total and added sugars are not added together or equated with free sugars. Food-and-beverage estimate, not urine measurement; excludes supplements and medications.
Dietary patterns
Quantitative findingSurvey

5% considered themselves vegetarian and 2% vegan in two questions about their eating preferences.

Scope, method and limitations
Observation period
July 1–19, 2026
Unit
% of adults
Population or sample
Random sample of 1200 adults aged 18+ in U.S. states and the District of Columbia.
Geographic scope
Consumption-habits survey from July 1 to 19, 2026.
Definition and method
Landline and mobile interviews, random-digit dialing and national demographic weighting; self-identification with separate questions for each label.
Comparison limitations
Partial coverage: questions specify no food exclusions and do not verify intake. No quantification of flexitarianism or adherence, and categories are not added together. Sampling, nonresponse and question wording limit precision, particularly for small groups.

Shopping, prices and waste

7/7
Shopping, prices and waste — United States
IndicatorFindings and context
Food expenditure
Quantitative findingPurchases

Mean annual food expenditure: 10633 USD per consumer unit, comprising 6491 USD for food at home and 4142 USD away from home; food represents 13.0% of total expenditure.

Scope, method and limitations
Observation period
2025
Unit
USD/consumer unit/year; % of annual total expenditure
Population or sample
U.S. consumer units: families, financially independent individuals or people living together who share major expenses; not necessarily equivalent to households.
Geographic scope
Consumer Expenditure Surveys, 2025; national annual estimates.
Definition and method
Combined Interview and Diary Surveys with weighting. Weights were adjusted for missing October and November 2025 collection during the lapse in federal appropriations.
Comparison limitations
Partial coverage: per consumer unit, not per person; no monthly conversion. Alcohol is separate. Food at home excludes nonfood items; food away includes tips, takeout and delivery. Estimates are subject to sampling and nonresponse error.
Cost of a common basket
Quantitative findingPurchases

The specified holiday cookout basket for 10 guests cost 73.82 USD.

Scope, method and limitations
Observation period
2026
Unit
USD/specified cookout basket
Population or sample
Prices collected by volunteer shoppers at stores in every U.S. state and Puerto Rico; sample size not published.
Geographic scope
Informal 2026 July celebration basket survey; release dated June 24, 2026, with no exact fieldwork dates published.
Definition and method
Menu of ground beef (2 lb), chicken breasts (2 lb), pork chops (3 lb), cheese (1 lb), buns (one package), potato salad (2½ lb), pork and beans (32 oz), chips (16 oz), cookies (13 oz), ice cream (½ gallon), strawberries (2 pints) and lemonade (2½ quarts).
Comparison limitations
Partial coverage: one holiday basket, not a usual budget or complete diet. Brands, stores and bun package size are unspecified. Volunteer sampling, not a national probability estimate. Original units retained without conversion or comparison with other baskets.
Cost of specific meals
Quantitative findingRecipe sample

Chicken Pot Tots: 1.61 USD per serving; the recipe declares 8 servings and a 301 g serving.

Scope, method and limitations
Observation period
May 2024
Unit
USD/labelled serving
Population or sample
One home recipe with chicken, vegetables and potatoes in the ONIE calendar; not a restaurant or household sample.
Geographic scope
May 2024 prices; recipe published in the 2025 calendar.
Definition and method
Ingredient-cost calculation using prices from a national grocery chain; serving defined by the recipe’s nutrition label.
Comparison limitations
Partial coverage: a dated example, not a national average or current price. Chain, store, city and treatment of labor, energy or taxes are unspecified. Weight is labelled, not an independent measurement of served portions.
Grocery shopping locations
Quantitative findingPurchases

Shares of food-acquisition transaction expenditure: 55% at large grocery stores, 3% at small or specialty stores and 7% at other food-at-home stores.

Scope, method and limitations
Observation period
April 2012–January 2013
Unit
% of food-acquisition transaction expenditure
Population or sample
Noninstitutionalized households in the continental United States; initial sample of 4826 households.
Geographic scope
FoodAPS, April 2012–January 2013; food acquisitions by all household members over one week.
Definition and method
Weekly records of paid or free acquisitions, with oversampling of SNAP and low-income households and national weighting.
Comparison limitations
Partial historical coverage. The share table uses 4665 observations. Expenditure includes taxes, applicable tips and nonfood items on the same receipt: it is neither food-only expenditure nor the percentage of shoppers. This is not a complete breakdown of current channels.
Shopping frequency
Quantitative findingPurchases

2.81 weekly acquisitions at large grocery stores among households with at least one acquisition there.

Scope, method and limitations
Observation period
April 2012–January 2013
Unit
acquisition events/household/week, conditional on any
Population or sample
Noninstitutionalized households in the continental United States; initial sample of 4826 households.
Geographic scope
FoodAPS, April 2012–January 2013; food acquisitions by all household members over one week.
Definition and method
Weekly records of paid or free acquisitions, with oversampling of SNAP and low-income households and national weighting.
Comparison limitations
Partial historical coverage; mean conditional on at least one acquisition in that category, not an average across all households. The table does not publish subgroup sample size. An acquisition need not be a separate trip; no conversion to monthly frequency or individual meals.
Prepared food and delivery
Quantitative findingPurchases

5.44 weekly acquisitions from restaurants and other eating places among households with at least one acquisition in that category.

Scope, method and limitations
Observation period
April 2012–January 2013
Unit
acquisition events/household/week, conditional on any
Population or sample
Noninstitutionalized households in the continental United States; initial sample of 4826 households.
Geographic scope
FoodAPS, April 2012–January 2013; food acquisitions by all household members over one week.
Definition and method
Weekly records of paid or free acquisitions, with oversampling of SNAP and low-income households and national weighting.
Comparison limitations
Partial historical coverage; mean conditional on at least one acquisition in that category, not an average across all households. The table does not publish subgroup sample size. An acquisition need not be a separate trip; no conversion to monthly frequency or individual meals.
Household food waste
Quantitative findingSurvey

Published household estimate: 73 kg of food waste per person per year, including associated inedible parts.

Scope, method and limitations
Observation period
2019; estimate published in 2024
Unit
kg/person/year, household food and inedible parts
Population or sample
U.S. residential sector, including single-family and multifamily dwellings; excludes food service and retail sectors.
Geographic scope
Sector estimate based on the U.S. report for 2019, published in the 2024 food waste index.
Definition and method
Synthesis of empirical generation studies, normalized and scaled with national statistics; the international report publishes the per-person result.
Comparison limitations
Partial historical coverage: not direct national weighing in 2019 or 2024. Generation factors come from older studies, and edible food is not separated from inedible parts. No verified national food-type or reason breakdown here; no inferred trends or addition of other sectors. The estimate includes food sent to sewers, a route not covered in many other national estimates; the report advises against that comparison. The residential composting profile excludes backyard and community composting and may underestimate that route.

Seasons and celebrations

2/2
Seasons and celebrations — United States
IndicatorFindings and context
Seasonal produce
Qualitative descriptionCultural context

Northwest Indiana harvest windows: cucumbers July 15–September 15; tomatoes July 15–October 15; apples July 15–November 1; grapes July 1–October 1.

Scope, method and limitations
Population or sample
Local crops in the Northwest Indiana agricultural area, United States; not all national production.
Geographic scope
Published regional crop calendar; the section used states no observation year or particular harvest year.
Definition and method
Rows explicitly identified as harvest in the official agricultural-employment guide; planting, hoeing and pruning dates excluded.
Comparison limitations
Partial regional qualitative coverage, not an availability survey or intake measurement. Calendar windows do not guarantee stock at every market or date; not extrapolated to other states, imports or stored produce.
Celebration food
Qualitative descriptionCultural context

Independence Day, July 4: a festive menu documented in 2026 includes ground beef, chicken breasts and pork chops. Thanksgiving falls on the fourth Thursday in November; its nineteenth-century food history links turkey, cranberries and pumpkin pie.

Scope, method and limitations
Population or sample
U.S. federal holiday dates; one basket menu researched in the states and Puerto Rico, and historical documentation linked to New England.
Geographic scope
Annual calendar, illustrative 2026 menu and nineteenth-century food history are distinct. Thanksgiving’s day of the month varies by year.
Definition and method
Federal calendar, informal price survey of one menu and park-service historical interpretation; not a national survey of holiday food intake.
Comparison limitations
Partial cultural coverage. A proposed menu does not establish every household’s diet. Historical food associations do not measure current frequency or establish the colonial celebration’s meal; other celebrations and regional variations remain outside this example.

Coverage in progress

The editorial guide for this country is in preparation. You can already explore its recipes; regional attributions are added when documented.

Guide available in other languages: Español

Places and communities

One country, many cuisines

An initial selection of regions to explore. Culinary boundaries may differ from administrative divisions.

United States

Nuevo México

Cook

Recipes connected with United States

Each recipe documents one version. Geographic associations do not imply an exclusive origin.
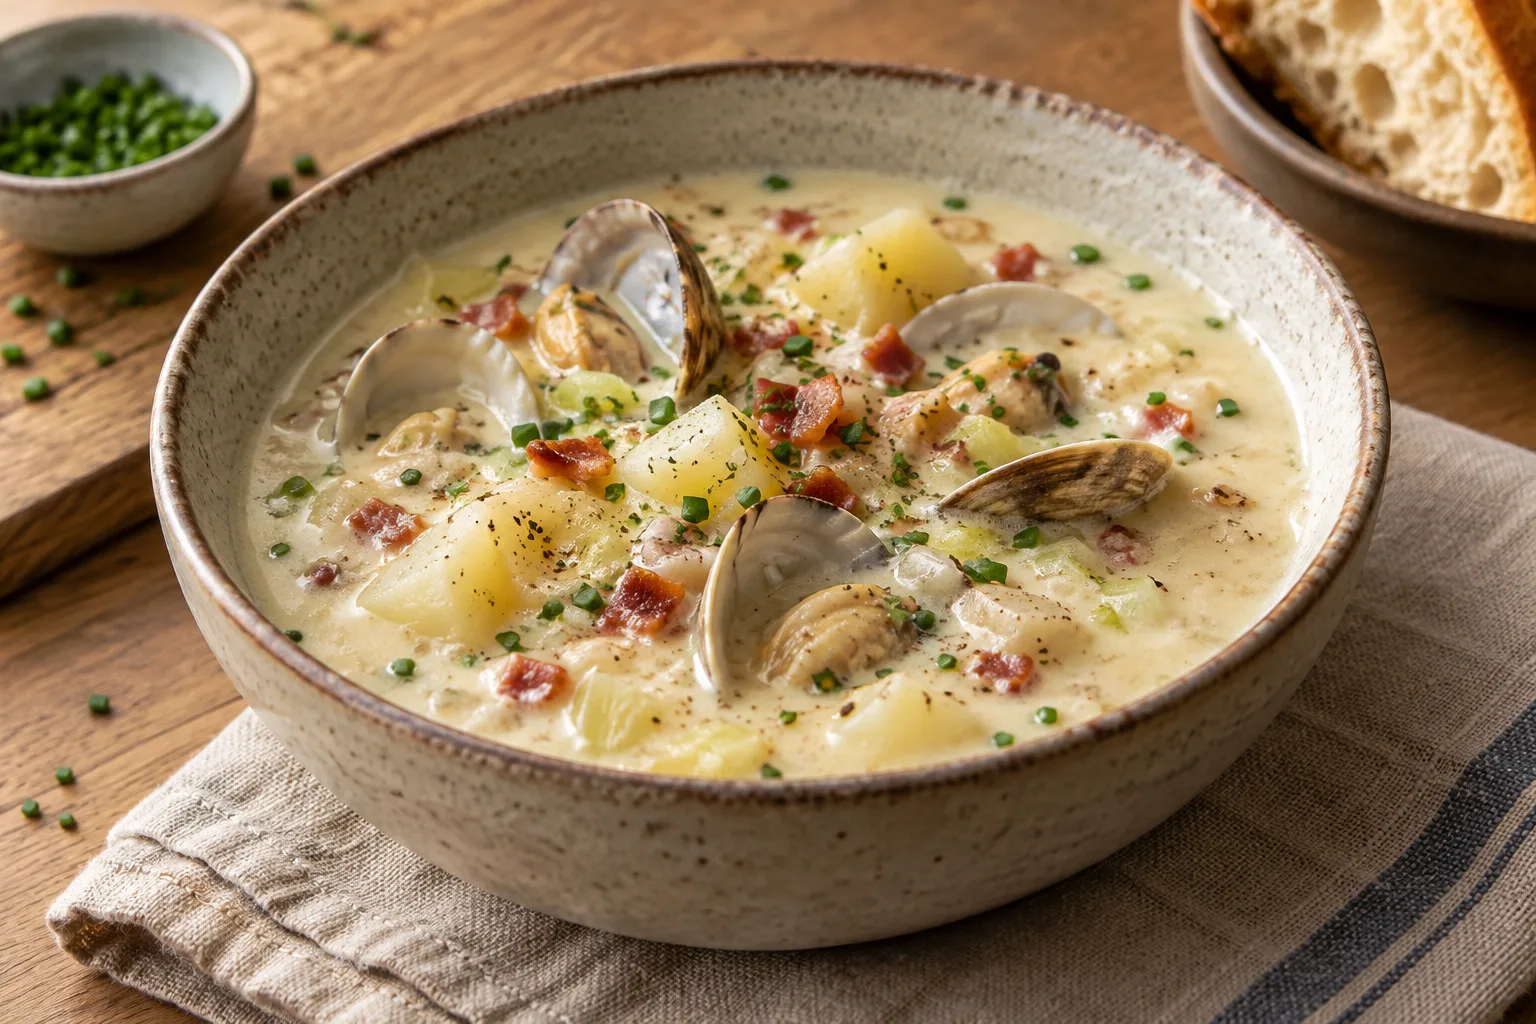
New England Clam Chowder
Image generated by the Kitchenpause team
60 minIntermediate

New England Clam Chowder

Creamy clam soup with bacon, potatoes, leek, spring onion, and celery, thickened with flour and finished with milk and cream.

View recipe

Sources consulted

Read the sources and each document’s scope. A heritage inscription concerns a particular practice, not all of a country’s cuisine.

  1. Eating and Health Module2023 summary www.ers.usda.gov/data-products/eating-and-health-module-atus/summary-findings USDA Economic Research Service Consulted: November 4, 2026
  2. Frequency and Time of Day That Americans Eat, TB1954 ers.usda.gov/sites/default/files/_laserfiche/publications/93514/TB-1954.pdf?v=67871 USDA Economic Research Service Consulted: November 4, 2026
  3. Breakfast Consumption by U.S. Adults2017–March2020 www.ars.usda.gov/ARSUserFiles/80400530/pdf/DBrief/59_Breakfast_Consumption_by_Adults_1720.pd… USDA Agricultural Research Service Consulted: November 4, 2026
  4. Lunch Consumption by U.S.Adults,2017–March2020 www.ars.usda.gov/ARSUserFiles/80400530/pdf/DBrief/57_Lunch_Consumption_by_Adults_1720.pdf USDA Agricultural Research Service Consulted: November 4, 2026
  5. Dinner Consumption by U.S.Adults,2017–March2020 www.ars.usda.gov/ARSUserFiles/80400530/pdf/DBrief/55_Dinner_Consumption_by_Adults_1720.pdf USDA Agricultural Research Service Consulted: November 4, 2026
  6. Snack Consumption by U.S.Adults,2017–March2020 www.ars.usda.gov/ARSUserFiles/80400530/pdf/DBrief/53_Snacks_Consumption_by_Adults_1720.pdf USDA Agricultural Research Service Consulted: November 4, 2026
  7. Prevalence and patterns of cooking dinner at home, NHANES2007–2008 www.cambridge.org/core/services/aop-cambridge-core/content/view/56FAF38A1200B8B90AB23864B03D… Virudachalam et al., Public Health Nutrition Consulted: November 4, 2026
  8. Sharing meals is associated with greater wellbeing www.nature.com/articles/s41598-026-46771-9 Scientific Reports Consulted: November 4, 2026
  9. Food Availability and Consumption: cereal products2022 www.ers.usda.gov/data-products/ag-and-food-statistics-charting-the-essentials/food-availabil… USDA Economic Research Service Consulted: November 4, 2026
  10. The networks of ingredient combinations as culinary fingerprints of world cuisines pmc.ncbi.nlm.nih.gov/articles/PMC12635264/ Caprioli et al., npj Science of Food Consulted: November 4, 2026
  11. Food Patterns Equivalents Intakes, by Male/Female and Age, August 2021–August 2023 www.ars.usda.gov/ARSUserFiles/80400530/pdf/fped/Table_1_FPED_MaleFemale_2123.pdf USDA Agricultural Research Service Consulted: November 4, 2026
  12. Federal Data Analysis Report: Current Intakes of Nutrients and Dietary Components www.dietaryguidelines.gov/sites/default/files/2024-12/DA_Report_Current_Intakes_of_Nutrients… USDA/HHS Federal Data Analysis Team Consulted: November 4, 2026
  13. Food Category Sources of Dietary Protein, supplemental tables19.19a and19.20a www.dietaryguidelines.gov/sites/default/files/2024-12/DA_Supplement_Food_Category_Sources_Di… USDA/HHS Federal Data Analysis Team Consulted: November 4, 2026
  14. Food Category Sources Analysis Methodology, 2025 DGAC supplementary data analysis www.dietaryguidelines.gov/sites/default/files/2024-12/DA_Supplement_Food_Category_Sources_Me… USDA/HHS Federal Data Analysis Team and Mathematica Consulted: November 4, 2026
  15. Assessing Dietary Consumption of Toxicant-Laden Foods and Beverages by Age and Ethnicity in California: Implications for Proposition65 pmc.ncbi.nlm.nih.gov/articles/PMC12525620/ Nutrients, original research, doi10.3390/nu17193149 Consulted: November 4, 2026
  16. YouGov Survey: Condiments, January30–February1,2026 ygo-assets-websites-editorial-emea.yougov.net/documents/Condiments_poll_results.pdf YouGov Consulted: November 4, 2026
  17. Foods Commonly Eaten in the United States: Quantities Consumed per Eating Occasion and in a Day,1994–1996 www.ars.usda.gov/ARSUserFiles/80400530/pdf/Portion.pdf USDA Agricultural Research Service Consulted: November 4, 2026
  18. Residential Cooking Behavior in the United States: Data Collected from a Web-Based Survey www.osti.gov/servlets/purl/1242417 Lawrence Berkeley National Laboratory / U.S. Department of Energy Consulted: November 4, 2026
  19. Survey of Home Canning Practices and Safety Issues in the U.S. nchfp.uga.edu/papers/2007/canning_survey.html National Center for Home Food Preservation, University of Georgia Consulted: November 4, 2026
  20. General Information on Fermenting nchfp.uga.edu/how/ferment/general-information-on-ferment/general-information-on-fermenting/ National Center for Home Food Preservation / USDA Consulted: November 4, 2026
  21. In 2020, most U.S. households prepared at least one hot meal a day at home www.eia.gov/TodayinEnergy/detail.php?id=53439 U.S. Energy Information Administration Consulted: November 4, 2026
  22. Nonalcoholic Beverage Consumption Among Youth and Adults: United States, August 2021–August 2023. NCHS Data Brief 568, September 2026 portugues.cdc.gov/nchs/products/databriefs/db568.htm CDC / National Center for Health Statistics Consulted: November 4, 2026
  23. Fall 2025 National Coffee Data Trends: Grounds for celebration www.ncausa.org/Newsroom/Grounds-for-celebration-Americans-remain-committed-to-coffee National Coffee Association / Dig Insights Consulted: November 4, 2026
  24. Nutrient Intakes from Food and Beverages: Mean Amounts Consumed per Individual, by Male/Female and Age, August 2021–August 2023 www.ars.usda.gov/ARSUserFiles/80400530/pdf/2123/Table_1_NIN_MaleFemale_2123.pdf USDA Agricultural Research Service Consulted: November 4, 2026
  25. Gallup Poll Social Series: Consumption Habits, July 1–19, 2026, Final Topline news.gallup.com/file/poll/713663/2026_08_Lifestyle%20Topline%20and%20Tabs.pdf Gallup Consulted: November 4, 2026
  26. Consumer Expenditures Summary, 2025 www.bls.gov/news.release/cesan.nr0.htm U.S. Bureau of Labor Statistics Consulted: November 4, 2026
  27. Cost of Fourth of July Cookout Reflects Inflation Increase, June 24, 2026 www.fb.org/news-release/cost-of-fourth-of-july-cookout-reflects-inflation-increase American Farm Bureau Federation Consulted: November 4, 2026
  28. Choose Homemade Recipes: 2025 ONIE Calendar onieproject.org/wp-content/uploads/2024/11/2025-ONIE-Calandar-Web-1.pdf ONIE Project Consulted: November 4, 2026
  29. Food Waste Index Report 2024 brasil.un.org/sites/default/files/2024-03/food_waste_index_report_2024.pdf United Nations Environment Programme Consulted: November 4, 2026
  30. 2019 Wasted Food Report www.epa.gov/system/files/documents/2024-04/2019-wasted-food-report_508_opt_ec_4.23correction… U.S. Environmental Protection Agency Consulted: November 4, 2026
  31. Where Households Get Food in a Typical Week: Findings From USDA’s FoodAPS, EIB-156 www.ers.usda.gov/sites/default/files/_laserfiche/publications/80542/EIB-156.pdf?v=26837 USDA Economic Research Service Consulted: November 4, 2026
  32. Indiana Seasonal Crop Calendar: Northwest Indiana, Crop Area 1 www.in.gov/dwd/job-seekers/migrant-and-seasonal-farm-worker/ Indiana Department of Workforce Development Consulted: November 4, 2026
  33. What are Federal holidays? www.opm.gov/frequently-asked-questions/pay-and-leave-faq/pay-administration/what-are-federal… U.S. Office of Personnel Management Consulted: November 4, 2026
  34. Traditional Thanksgiving Cooking www.nps.gov/articles/000/traditional-thanksgiving-cooking.htm U.S. National Park Service Consulted: November 4, 2026
  35. Luisiana y sus tradiciones www.visittheusa.com/destinations/louisiana/ Brand USA — Visit The USA
  36. Massachusetts: productos y cocinas del Atlántico www.visittheusa.com/destinations/massachusetts/ Brand USA — Visit The USA
  37. Nuevo México: cocinas y culturas traveltrade.visittheusa.com/destinations/new-mexico/ Brand USA — Visit The USA

We use session and security technologies to provide our features. Only with your permission do we load Google Analytics to measure visits and Google Maps on Contact. Choose separately, reject or accept both.

Withdraw either permission here. Withdrawing analytics reloads the page to unload the running tag.

Cookie policy