Food and eating habits
How people eat in Kenya
50 indicators exploring everyday meals, ingredients and food culture. Information is completed progressively from documented evidence.
48 of 50 indicators with documented information
Not all data are comparable: food supply, purchases and intake are different measures. Check the period, population and method for each finding. Qualitative descriptions do not establish percentages or amounts.
Timing and company
7/8
| Indicator | Findings and context |
|---|---|
| Meal times |
Local peaks: breakfast 8–9 am, lunch 1–2 pm and dinner 8–9 pm, local time. Scope, method and limitations
|
| Meals per day |
Mean 3.7 food/drink episodes per day; not 3.7 main meals. Scope, method and limitations
|
| Meal duration |
21.5%of episodes lasted under 10 minutes and 27.6%at least 30 minutes. Not a mean for each breakfast, lunch or dinner. Scope, method and limitations
|
| Daily energy distribution |
Mean per woman/day: Kitui, breakfast 444 kcal, lunch 619 kcal, dinner 716 kcal, other times 143 kcal; Vihiga, 603 kcal, 612 kcal, 615 kcal, 292 kcal, respectively. Energy amounts, not daily percentages. Scope, method and limitations
|
| Weekdays and weekends | Insufficient data in the sources consulted |
| Eating at home and away |
77.5%of episodes occurred at home and 12.2%on the street. Episode contexts, not percentages of people. Scope, method and limitations
|
| Cooking frequency |
In 2021, 57.6%of people participated in food/meals management and preparation on the prior day. Population mean 92.1 minutes/day; participants 160.0 minutes. Not weekly cooking days or only time at the stove. Scope, method and limitations
|
| Eating together |
41.7%of episodes were taken alone and 46.5%with family. Not added or converted to percentages of people. Scope, method and limitations
|
Pantry and recipes
2/2
| Indicator | Findings and context |
|---|---|
| Most consumed ingredients |
Annual food supply per person for three balance-sheet categories: maize and products, 62.1 kg; wheat and products, 37.7 kg; potatoes and products, 32.4 kg. Scope, method and limitations
|
| Ingredient prevalence in recipes |
In the selected entries, whole-maize-flour ugali combines that flour with water. Fresh-maize-and-bean githeri also includes spring onion, cooking fat and iodized salt. Two specific cookbook formulations, without prevalence percentages. Scope, method and limitations
|
Cereals and plant foods
6/6
| Indicator | Findings and context |
|---|---|
| Cereals and cereal products |
Annual food supply per person: maize and products 62.1 kg; wheat and products 37.7 kg; rice and products in milled equivalent 15.2 kg. Scope, method and limitations
|
| Bread |
Selected white/brown chapati formulations use refined wheat flour and whole-wheat atta flour, respectively. Both include water, sugar, salt and oil; discs are formed and pan-cooked on both sides. Scope, method and limitations
|
| Pulses |
Annual food supply per person: dry beans and products 11.7 kg; dry peas and products 2.4 kg. Dry-pulse balance categories, not cooked portions. Scope, method and limitations
|
| Vegetables |
Annual food supply per person: tomatoes and products 8.1 kg; other vegetables and products, the grouped residual balance category, 34.4 kg. Scope, method and limitations
|
| Fruit |
Annual food supply per person: bananas 32.4 kg; plantains 10.4 kg. The balance records them as separate categories. Scope, method and limitations
|
| Potatoes, roots and tubers |
Annual food supply per person: potatoes and products 32.4 kg; cassava and products 20.9 kg; sweet potatoes 10.4 kg. Scope, method and limitations
|
Protein foods
5/5
| Indicator | Findings and context |
|---|---|
| Meat |
Annual food supply per person: total meat category 10.8 kg; bovine meat and products 5.0 kg; sheep/goat meat and products 2.2 kg; pig meat and products 0.7 kg; poultry meat and products 1.8 kg. Scope, method and limitations
|
| Fish and seafood |
Annual food supply per person: fish and seafood 3.2 kg; freshwater-fish subcategory 2.4 kg. Scope, method and limitations
|
| Eggs |
Annual food supply per person of eggs and products: 2.3 kg. Weight is not converted into an egg count. Scope, method and limitations
|
| Milk and dairy products |
Annual food supply per person for milk and products excluding butter: 93.5 kg. This aggregate row does not separate liquid milk, cheese and yogurt. Scope, method and limitations
|
| Protein sources |
In the Nairobi sample, median contributions to protein intake: cereals and grain products 23.3%; meat and eggs 22.0%; dairy 11.7%; legumes, pulses, seeds and nuts 10.7%. Scope, method and limitations
|
Fats, flavours and condiments
3/3
| Indicator | Findings and context |
|---|---|
| Cooking fats |
Annual food supply per person: vegetable oils 1.7 kg; within that group, palm oil 1.3 kg. Total and subcategory are not added. Scope, method and limitations
|
| Herbs and spices |
In the selected pilau, cumin seeds are dry-toasted and cardamom, cinnamon, cloves and black pepper are toasted separately before grinding. Garlic, ginger and fresh coriander are also used. Scope, method and limitations
|
| Sauces and condiments |
The selected groundnut sauce combines ground peanuts, salt, water and sour milk; water or fresh milk may replace sour milk. It is heated until smooth and served hot with leafy vegetables, fish, sweet potatoes, green bananas or ugali. Scope, method and limitations
|
Meal composition
6/6
| Indicator | Findings and context |
|---|---|
| Breakfast composition |
The selected basic mandazi is a fried dough of wheat flour, baking powder, sugar, water and oil, described as a breakfast food. The selected chai ya maziwa combines tea, water, cow’s milk and sugar. Two examples, not a compulsory menu. Scope, method and limitations
|
| Main meal composition |
The selected pilau combines rice, beef, potato and spices. Its cultural context is Swahili Friday lunch, with kachumbari and ripe banana as described accompaniments. Scope, method and limitations
|
| Dinner composition |
The selected whole-maize-flour ugali is made with flour and water and described as a lunch or supper dish accompanied by a vegetable or protein dish. Scope, method and limitations
|
| Appetisers and snacks |
The selected enriched mandazi contains wheat flour, eggs, milk, margarine, sugar and lemon rind; it is shaped and fried. It is described as an urban snack and breakfast food. Scope, method and limitations
|
| Desserts and sweets |
Vimumunya vya sukari combines pumpkin, coconut milk, sugar and cardamom: an example of a Swahili after-meal dessert. Siro combines semolina, ghee, milk, sugar and cardamom with almonds and pistachios, and is linked to Kenya’s Indian community. Scope, method and limitations
|
| Portion sizes |
Median amount of maize-flour ugali per eating occasion: 325 g in Kitui and 300 g in Vihiga among the women studied. Portions of the consumed preparation, not dry flour weight or recommended servings. Scope, method and limitations
|
Techniques and equipment
5/5
| Indicator | Findings and context |
|---|---|
| Cooking techniques |
In the selected examples, basic mandazi is deep-fried; white chapati is pan-cooked on both sides; maize ugali is mixed with boiling water and finished over reduced heat. Scope, method and limitations
|
| Vegetable preparation |
In the selected entries, sukuma wiki leaves are washed, de-stemmed and finely chopped, added to onion and tomato cooked in oil and finished over low heat. Chopped cabbage is cooked with onion, oil and salt while stirring. Scope, method and limitations
|
| Food preservation |
Documented meat-preservation examples include athola, fire-dried; aliya, sun-dried; and muranda, fire- and sun-dried. The note links these collectively to Luo and Luhya communities, without measuring frequency or giving preservation protocols. Scope, method and limitations
|
| Fermented foods |
Fermentation of foods was known and practiced in the community studied. Scope, method and limitations
|
| Kitchen equipment |
In 2022, 7.1% of households reported owning a microwave oven and 10.9% a refrigerator. National appliance-ownership percentages, not usage or percentages of people. Scope, method and limitations
|
Drinks
3/3
| Indicator | Findings and context |
|---|---|
| Everyday drinks |
In December 2019, 145 of 160 participants(90.6%)reported consuming tea and/or coffee. This combined category does not separate the two beverages. Scope, method and limitations
|
| Coffee and tea preparation |
Among 145 tea/coffee consumers, 109(75.2%)reported tea with milk. This describes tea accompaniment, without milk quantities or a coffee recipe. Scope, method and limitations
|
| Drinks with meals |
Tea taken with the meal was reported at breakfast 104/145(71.7%), lunch 47/88(53.4%)and supper 29/77(37.7%). Each meal has its own denominator; these are not percentages of the entire sample and are not added. Scope, method and limitations
|
Nutrition and dietary patterns
3/3
| Indicator | Findings and context |
|---|---|
| Energy and nutrients |
Daily means in Kitui: energy 1922 kcal, protein 61.1 g, fat 50.0 g, carbohydrate 284.8 g and fibre 43.4 g. In Vihiga: 2123 kcal, 60.7 g, 59.6 g, 317.8 g and 35.5 g, respectively. Observed/estimated intakes among the women studied. Scope, method and limitations
|
| Salt and sugars |
For the food group “sugar and sweeteners”, the mean was 27.4 g per woman per day in Kitui and 51.3 g in Vihiga. Grams of that recorded food group, not chemically measured total, added or free sugars. Salt and sodium are not quantified here. Scope, method and limitations
|
| Dietary patterns |
In the weighted Kenyan sample, 32%identified as reducetarian, flexitarian or semi-vegetarian; 6%as vegetarian; and 1%as vegan. The combined group restricts meat or eats it occasionally. Reported identities, not verification of all foods consumed. Scope, method and limitations
|
Shopping, prices and waste
6/7
| Indicator | Findings and context |
|---|---|
| Food expenditure |
Median monthly household food spending: 50 USD, interquartile range 60 USD. Not per-person spending. Source converted reported shillings at 100 KES perUSD. Scope, method and limitations
|
| Cost of a common basket |
Fixed basket per person/day: 415 g grains, 50 g beans, 35 ml oil, 100 ml milk, 100 g vegetables, 5 g sugar and 5 g salt. Monthly cost: 2408 KES cash or 2769 KES on credit. Same basket, different payment modes. Scope, method and limitations
|
| Cost of specific meals | Insufficient data in the sources consulted |
| Grocery shopping locations |
Purchases reported at open-air markets 365/376 households(97.1%), supermarkets 212/376(56.4%)and kiosks 309/376(82.2%). Buyer households by outlet, not spending shares. Scope, method and limitations
|
| Shopping frequency |
Participants described daily purchases of perishables such as milk/vegetables and weekly budgeting for cereals/flour. Daily purchases were linked to daily earnings, freshness and lack of refrigeration. No mean visit count estimated. Scope, method and limitations
|
| Prepared food and delivery |
In the reference month, 112 of 376 households reported restaurants, 14 of 376 fast food and 4 of 376 cafés as sources. Not weekly visits or delivery orders. Scope, method and limitations
|
| Household food waste |
Garissa survey participants reported expiry, over-preparation and poor preservation as waste causes. Bakery products, cereals and vegetables were among wasted groups. This description does not quantify annual kilograms. Scope, method and limitations
|
Seasons and celebrations
2/2
| Indicator | Findings and context |
|---|---|
| Seasonal produce |
For long-cycle seasonal crops, eastern regions toward the coast have long-rains harvest in July–August and short-rains harvest in February–March of the following year. Not a calendar of all horticulture or imported availability. Scope, method and limitations
|
| Celebration food |
Two documented historical examples: Nubian mkate kuta was served on the wedding day to escort the bride; Taita wukunu, sweet potato and dehulled black beans, was linked to weddings, burials and other occasions. Not universal current practices or fixed dates. Scope, method and limitations
|
Coverage in progress
The editorial guide for this country is in preparation. You can already explore its recipes; regional attributions are added when documented.
Guide available in other languages: Español
Places and communities
One country, many cuisines
An initial selection of regions to explore. Culinary boundaries may differ from administrative divisions.
Mombasa y costa suajili
Nairobi
Cook
Recipes connected with Kenya
Each recipe documents one version. Geographic associations do not imply an exclusive origin.
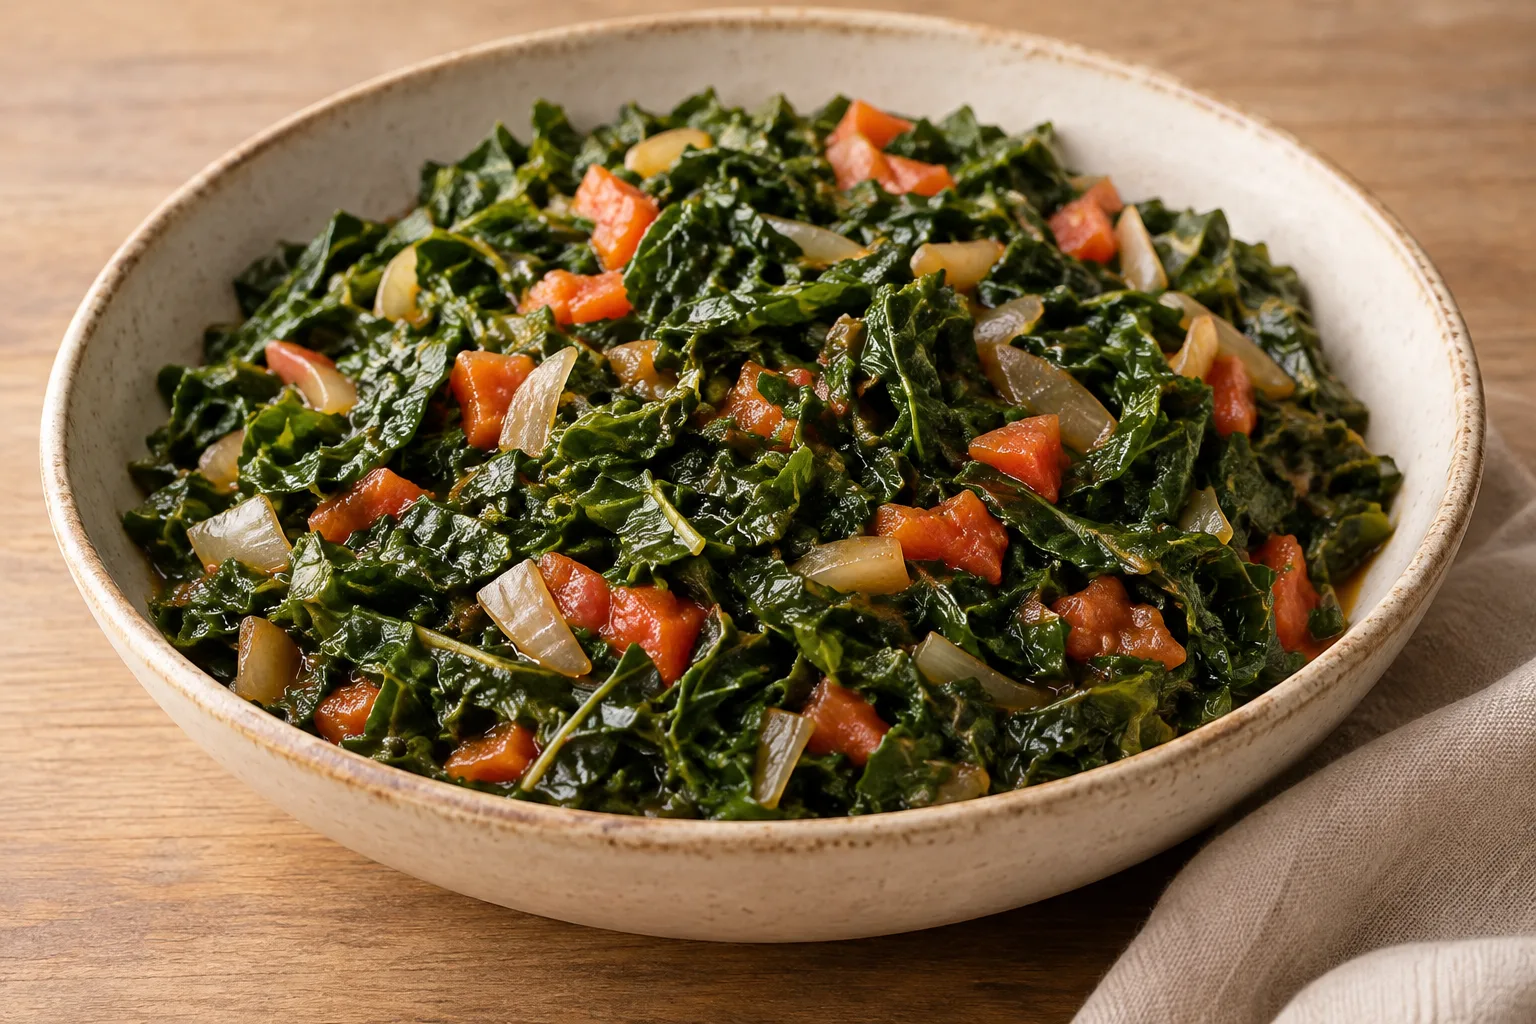
Kenyan Sukuma Wiki
Sukuma greens sautéed with onion and tomato and cooked until tender. Serves 4; preparation and cooking times are approximate.
View recipe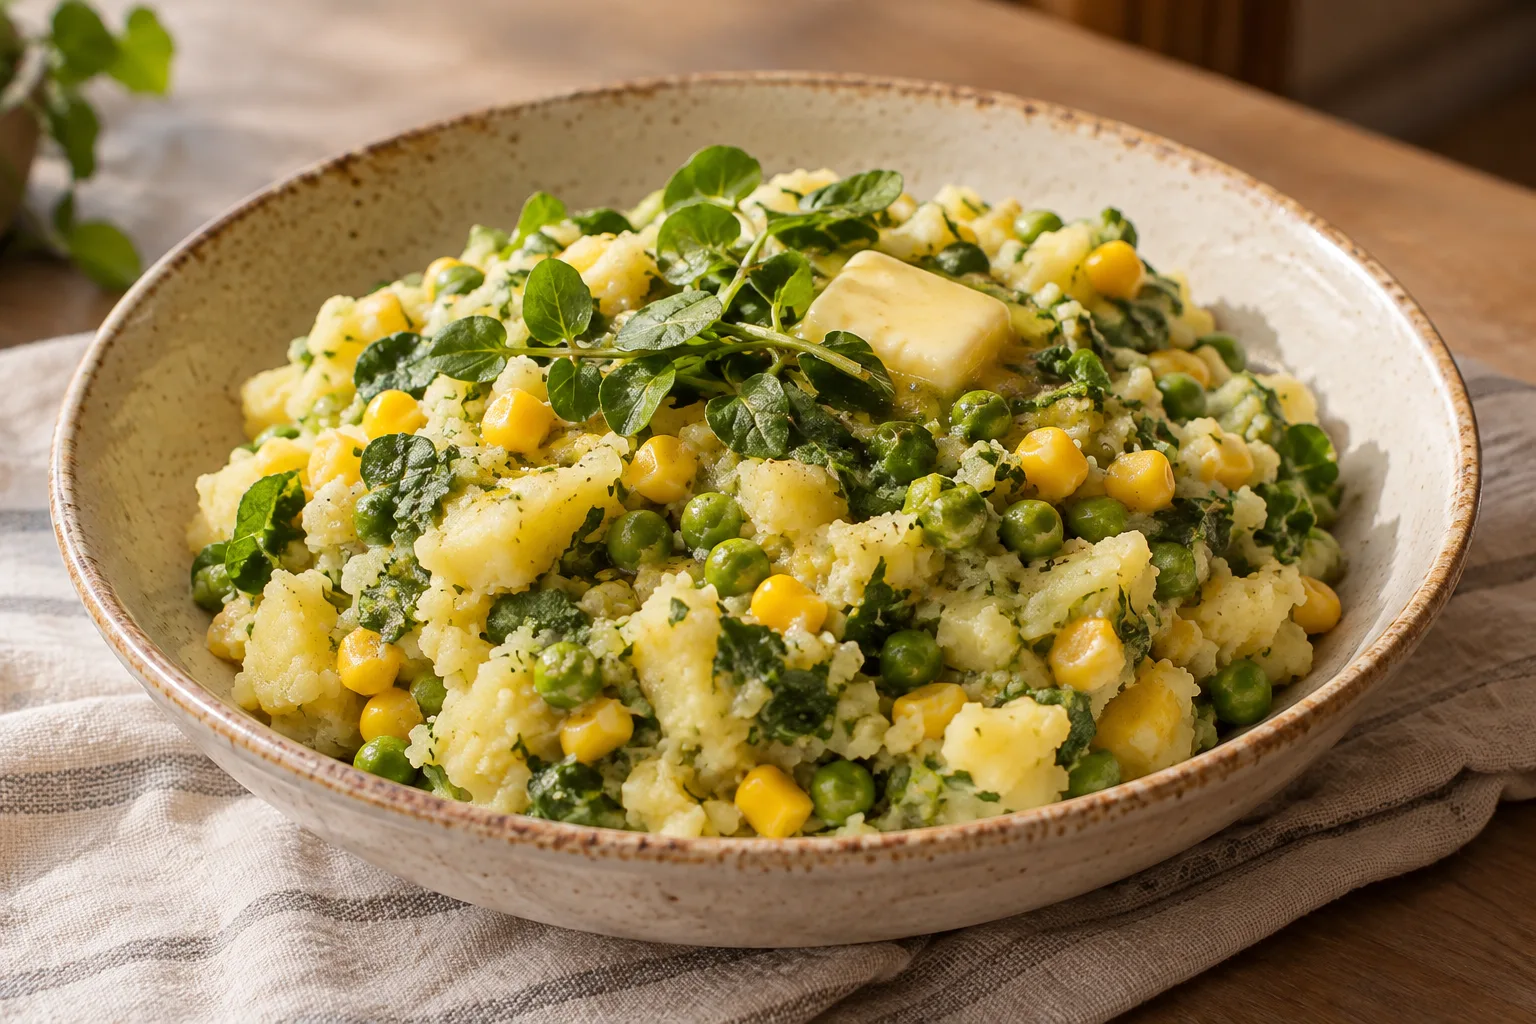
Kenyan irio
A rustic mash of potatoes, peas and corn, finished with watercress and butter. Makes about 4 servings.
View recipe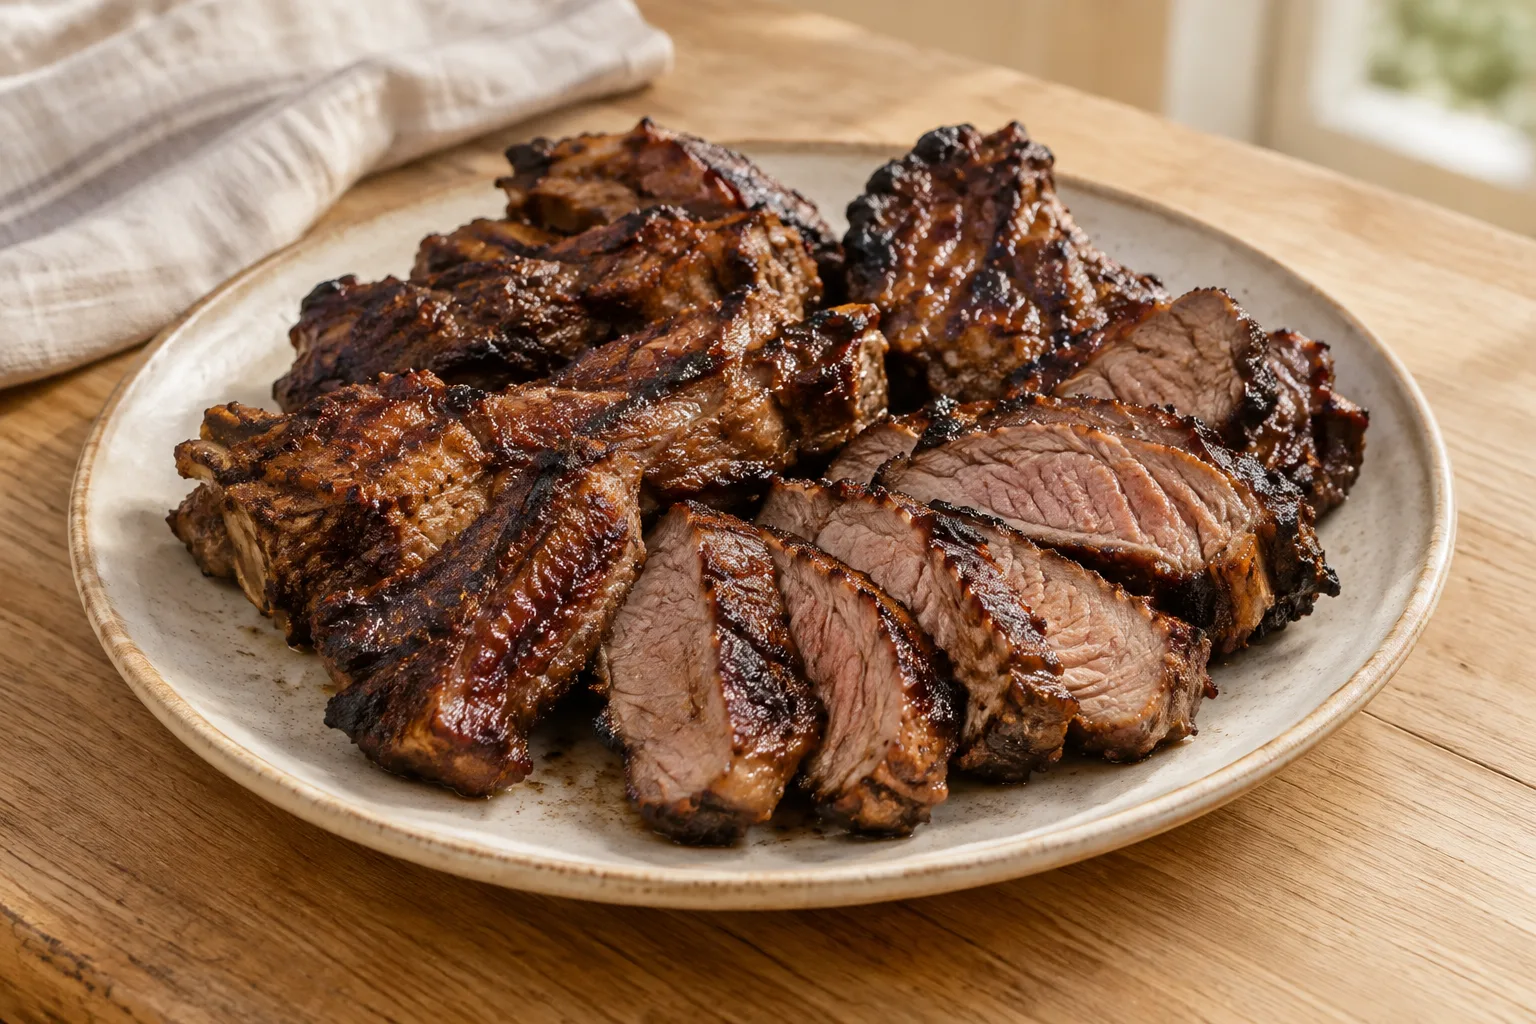
Kenyan Nyama Choma on the Grill
Goat or beef grilled slowly and basted with salt water. Serves 4; preparation time and yield are estimates.
View recipe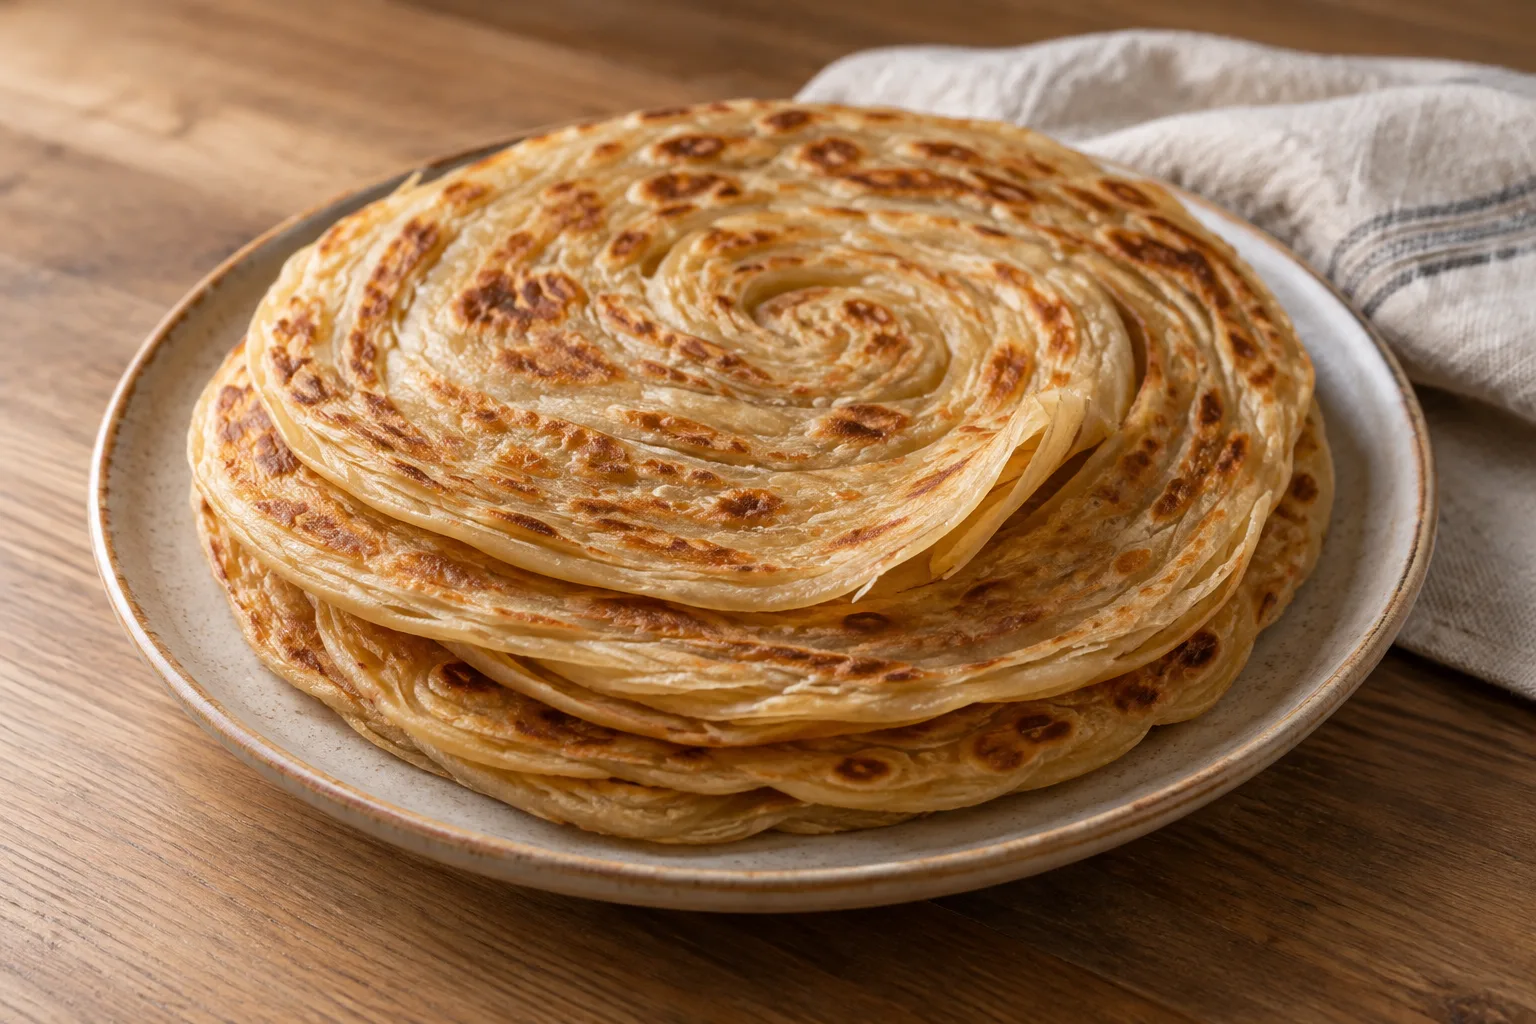
Layered Kenyan Chapati
Unleavened Kenyan flatbread, coiled into spirals to create layers and cooked in a pan until golden.
View recipe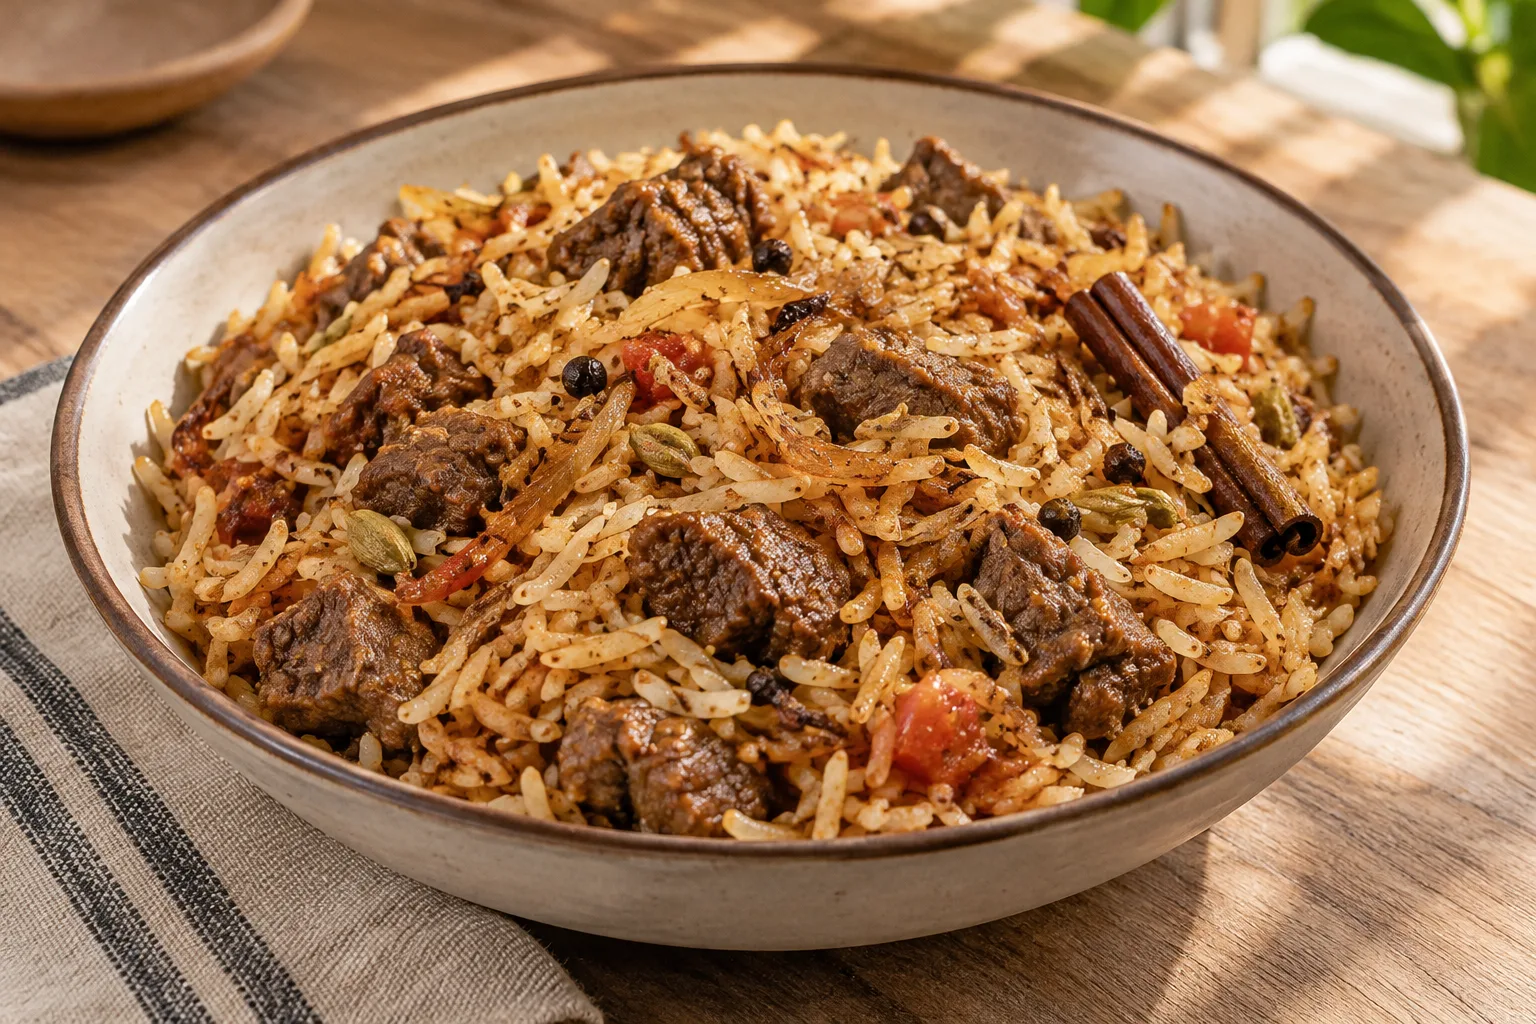
Kenyan beef pilau
Basmati rice cooked with beef, deeply browned onion, tomato, and toasted spices. Serves 4; preparation: 30 minutes; cooking: 55 minutes.
View recipe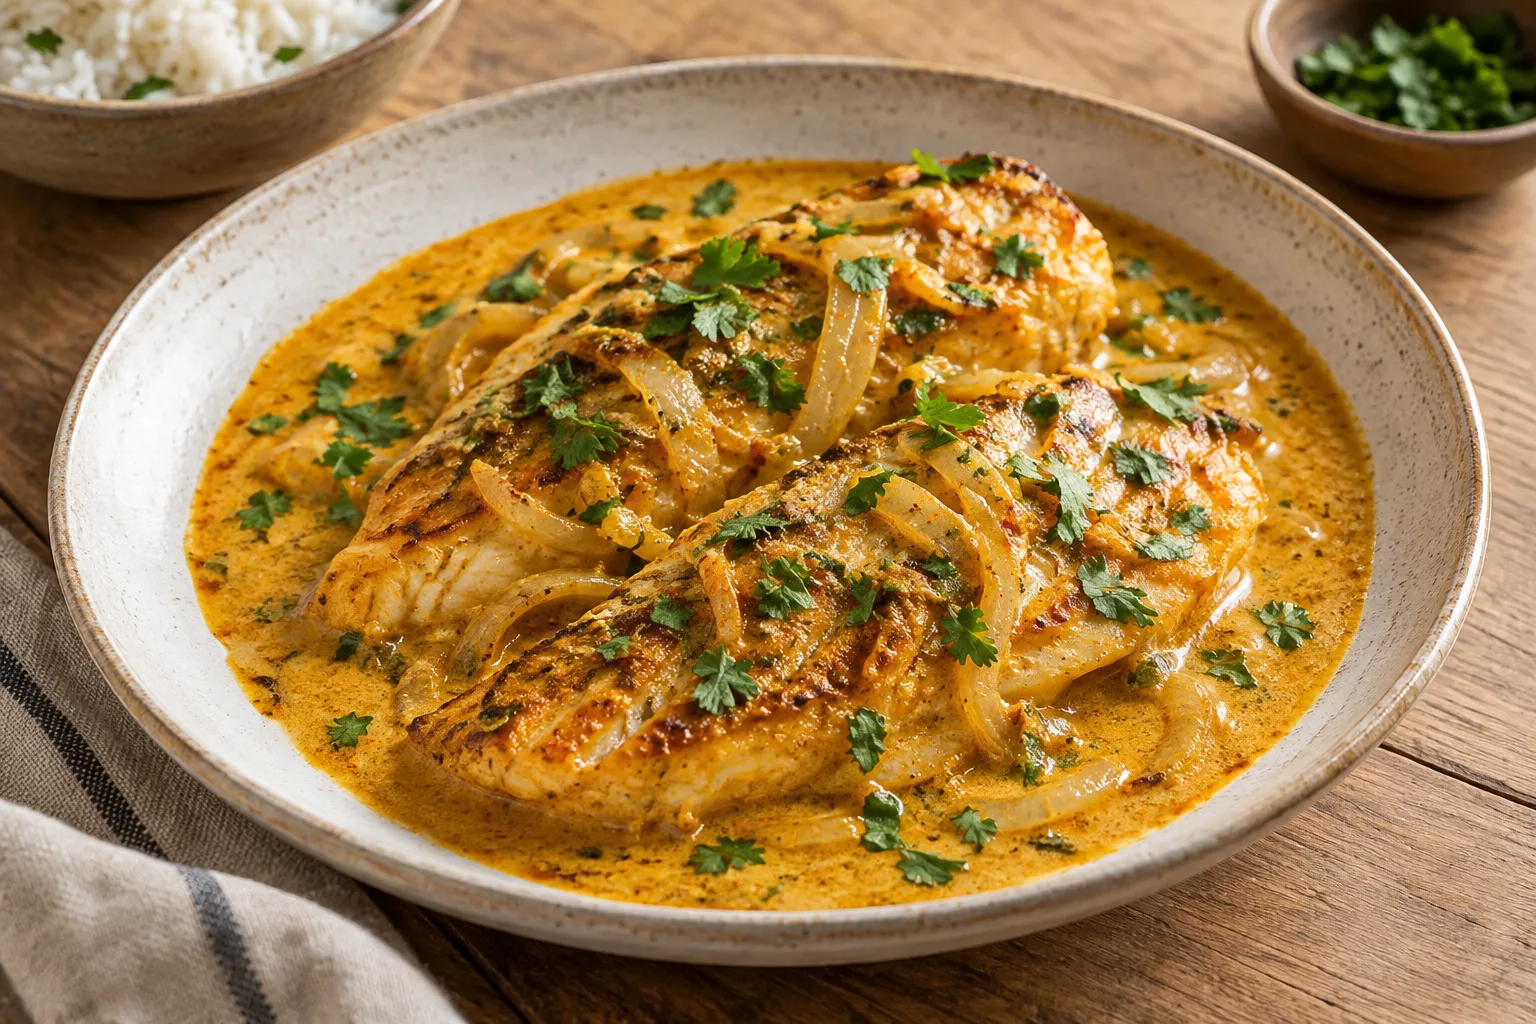
Kenyan Samaki wa Kupaka
Golden fish served with a creamy coconut, spice and tamarind sauce, in the style of Kenya’s Swahili coast.
View recipe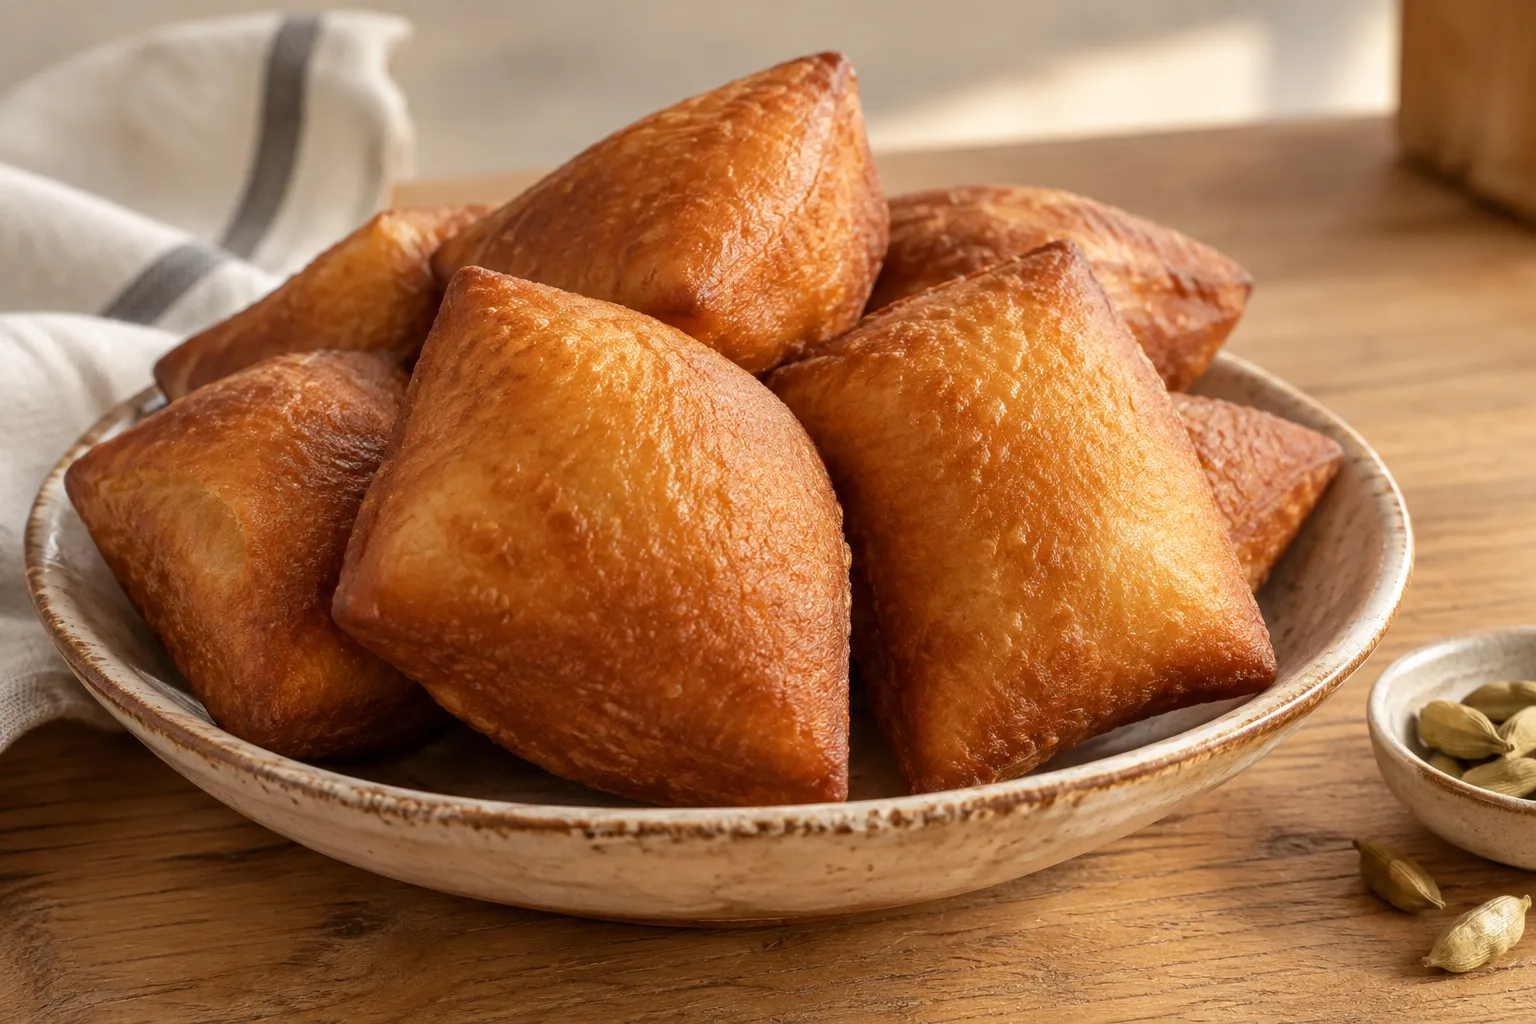
Kenyan Coconut and Cardamom Mahamri
Lightly sweet fried buns flavored with coconut milk and cardamom, from the Swahili tradition of Kenya’s coast.
View recipe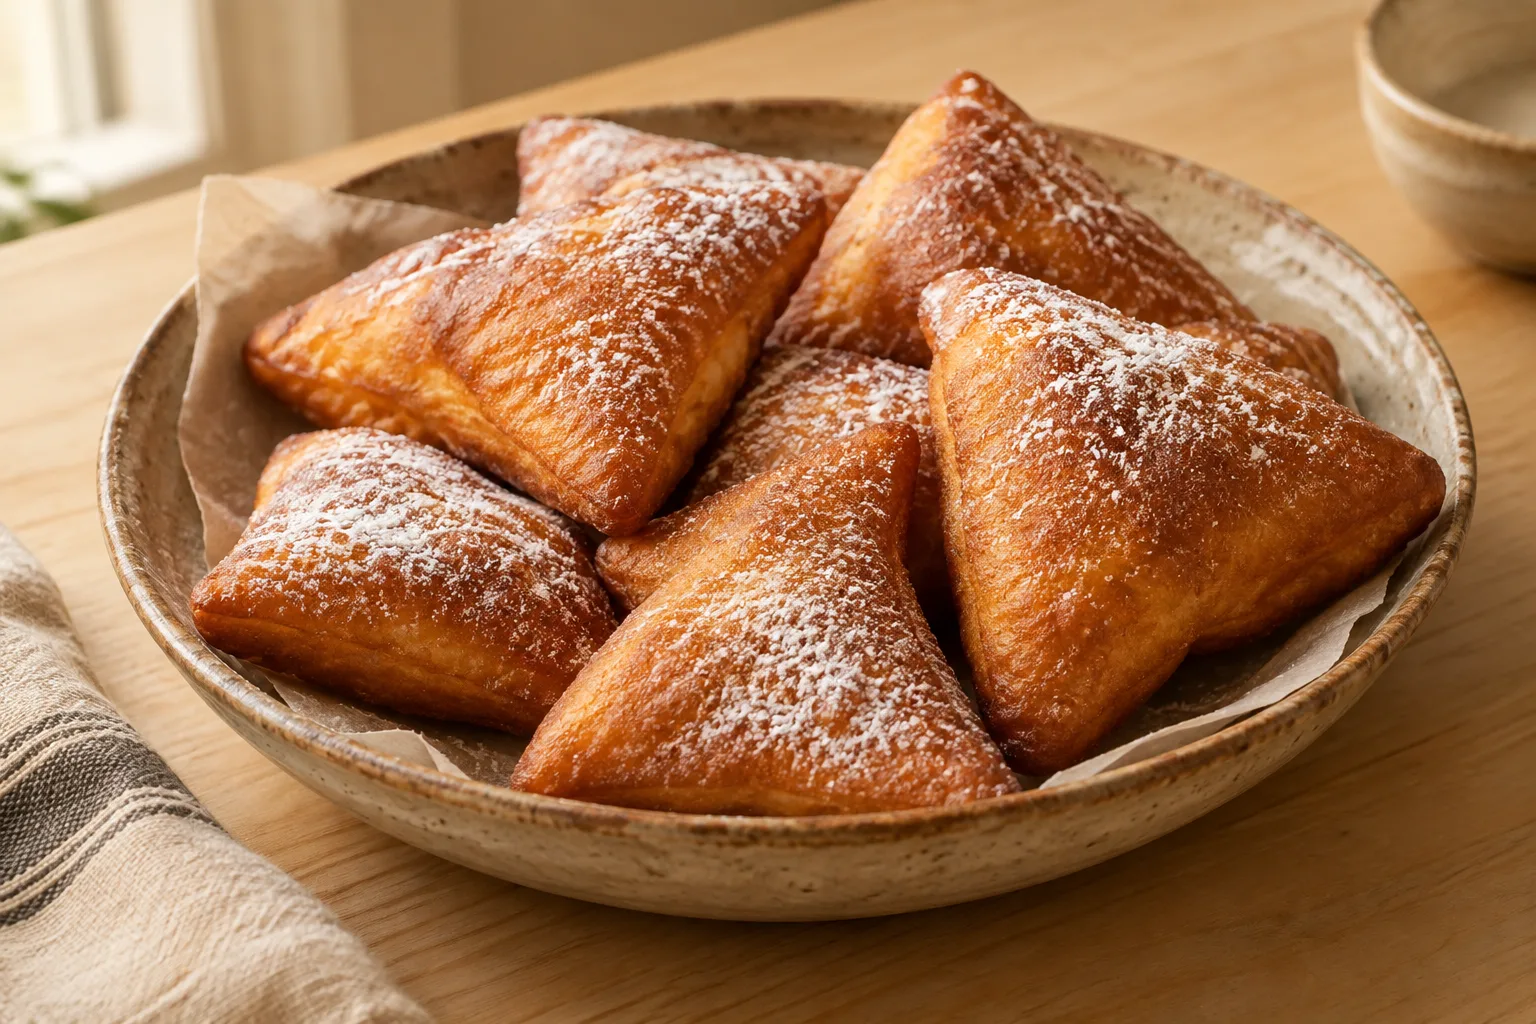
Kenyan Mandazi
Kenyan yeasted buns flavored with cardamom and cinnamon, cut into triangles, and fried. This version uses coconut milk; some sources call this variation mahamri.
View recipe
Sources consulted
Read the sources and each document’s scope. A heritage inscription concerns a particular practice, not all of a country’s cuisine.
- Kenyan Food Recipes2018: common mixed dishes with nutrient values,as prepared by communities www.fao.org/4/i9056en/I9056EN.pdf FAO; Government of Kenya,Ministry of Health and Ministry of Agriculture and Irrigation Consulted: November 3, 2026
- Home processed complementary foods, caregivers' knowledge, attitude, and practice in a rural community in Kenya: a mixed method study - PMC pmc.ncbi.nlm.nih.gov/articles/PMC11845992/ pmc.ncbi.nlm.nih.gov Consulted: October 30, 2026
- Kenya Demographic and Health Survey2022,Volume1:Table2.5Household possessions www.knbs.or.ke/wp-content/uploads/2023/08/Kenya-Demographic-and-Health-Survey-2022-Main-Repo… Kenya National Bureau of Statistics and ICF Consulted: November 3, 2026
- Economic Survey 2026: Food Balance Sheet2025,Table7.23(a) www.knbs.or.ke/wp-content/uploads/2026/04/2026-Economic-Survey.pdf Kenya National Bureau of Statistics Consulted: November 3, 2026
- Nutritional intake and food sources in an adult urban Kenyan population onlinelibrary.wiley.com/doi/10.1111/nbu.12582 Vila-Real et al.; Nutrition Bulletin / Wiley Consulted: November 3, 2026
- Characteristics of Dietary Intake in Relation to the Consumption of Home-Produced Foods among Farm Women in Two Rural Areas of Kenya: A Preliminary Study doi.org/10.3390/dietetics1030021 Kishino et al.; Dietetics2022 Consulted: November 3, 2026
- Consumption Pattern of Tea Is Associated with Serum Ferritin Levels of Women of Childbearing Age in Nandi County, Kenya: A Cross-Sectional Study karger.com/anm/article/80/2/109/894187/Consumption-Pattern-of-Tea-Is-Associated-with Karger; Nyakundi and colleagues Consulted: November 3, 2026
- Plant-based and Cultivated Meat Adoption in Egypt,Kenya,and Nigeria;June2022 research report www.fsrfund.org/s/FSRF-2021-1-012.pdf North Mountain Consulting Group;Keri Szejda,Moritz Stumpe,Yanqin Liu,Tessa Urbanovich Consulted: November 3, 2026
- Unhealthy eating practices of city-dwelling Africans in deprived neighbourhoods:Evidence for policy action from Ghana and Kenya eprints.whiterose.ac.uk/179106/1/1-s2.0-S2211912420301061-main.pdf Holdsworth and colleagues;Global Food Security2020 Consulted: November 3, 2026
- Kenya Time Use Survey2021:Table5.4 www.knbs.or.ke/wp-content/uploads/2023/10/Kenya-Time-Use-Survey-2021_1.pdf Kenya National Bureau of Statistics Consulted: November 3, 2026
- Socioeconomic inequalities in food purchasing practices and expenditure patterns:westernKenya www.frontiersin.org/journals/public-health/articles/10.3389/fpubh.2023.943523/full Were and colleagues;Frontiers in Public Health2023 Consulted: November 3, 2026
- Navigating the local foodscape:Kisumu andHomaBay bmcpublichealth.biomedcentral.com/articles/10.1186/s12889-022-13580-4 BMC Public Health2022 Consulted: November 3, 2026
- Refugee Debt and Livelihoods in Northern Kenya;Table1 data.unhcr.org/en/documents/download/111866 Bruni,Muthui,Rodgers,Sterck;RefugeeStudiesCentreOxford2024 Consulted: November 3, 2026
- Sociodemographic Determinants of Households Food Waste inGarissa bircu-journal.com/index.php/birci/article/download/921/pdf Huho,Kosonei,Musyimi;BIRCI2020 Consulted: November 3, 2026
- Kenya Data Book:seasonal crop calendar,2024Ministrydescription help.fews.net/fde/v3/kenya-country-book FEWS NET Consulted: November 3, 2026
- Kisumu: catálogo de destinos magicalkenya.com/download/4047/?tmstv=1733480113 Kenya Tourism Board
- Platos suajilis magicalkenya.com/experience/swahili-dishes/ Kenya Tourism Board
- Nairobi magicalkenya.com/city/nairobi/ Kenya Tourism Board