Asia · Southeast Asia
Indonesia
Rendang, soto, rice and sweets offer routes through regional techniques and the diverse culinary repertoires of the Indonesian archipelago.
Food and eating habits
How people eat in Indonesia
50 indicators exploring everyday meals, ingredients and food culture. Information is completed progressively from documented evidence.
49 of 50 indicators with documented information
Not all data are comparable: food supply, purchases and intake are different measures. Check the period, population and method for each finding. Qualitative descriptions do not establish percentages or amounts.
Timing and company
7/8
| Indicator | Findings and context |
|---|---|
| Meal times |
Breakfast, lunch and dinner peaked at 7.00, 12.00 and 19.00 h respectively, in reported local time. Scope, method and limitations
|
| Meals per day |
52.1% reported three main meals on the recalled day and 32.1% two; snacks are not included. Scope, method and limitations
|
| Meal duration | Insufficient data in the sources consulted |
| Daily energy distribution |
Breakfast contributed approximately 26% of daily energy. Scope, method and limitations
|
| Weekdays and weekends |
Interviews describe weekend changes in timing, meal counts and portions, varying with work. Scope, method and limitations
|
| Eating at home and away |
Interviewed office workers describe eating bought or home-packed food at work, and breakfast or dinner at home. Scope, method and limitations
|
| Cooking frequency |
57.8% of people responsible for cooking in the Indonesian sample reported preparing breakfast every weekday. Scope, method and limitations
|
| Eating together |
65.3% ate breakfast alone and 54.4% dinner. Scope, method and limitations
|
Pantry and recipes
2/2
| Indicator | Findings and context |
|---|---|
| Most consumed ingredients |
Published quantities: rice 92.1, vegetables 52.1 and fruit 37.2 kg per person per year. Selected categories, not an exhaustive ranking. Scope, method and limitations
|
| Ingredient prevalence in recipes |
Water present in 4 of 6 recipes; garlic in 3 of 6 and salt in 3 of 6. Scope, method and limitations
|
Cereals and plant foods
6/6
| Indicator | Findings and context |
|---|---|
| Cereals and cereal products |
Rice 92.1, wheat/wheat flour 16.1 and maize 1.5 kg per person per year, in the series’ standardised forms. Scope, method and limitations
|
| Bread |
One Jakarta participant described bread as an alternative to rice within a meal; this is a local testimony. Scope, method and limitations
|
| Pulses |
Soybean 9.1, peanut 0.3 and mung bean 0.4 kg per person per year, in published standardised forms, without conversion to cooked weight. Scope, method and limitations
|
| Vegetables |
Vegetables: 52.1 kg per person per year; the table groups species together. Scope, method and limitations
|
| Fruit |
Fruit: 37.2 kg per person per year; this table has no species breakdown. Scope, method and limitations
|
| Potatoes, roots and tubers |
Cassava 8.5, sweet potato 3.1, potato 2.5 and sago 0.6 kg per person per year, following the published categories. Scope, method and limitations
|
Protein foods
5/5
| Indicator | Findings and context |
|---|---|
| Meat |
Ruminant meat: 3.3; poultry: 9.9 kg per person per year in the published standardised form. Scope, method and limitations
|
| Fish and seafood |
Fish: 22.5 kg per person per year; no species or fresh-versus-preserved breakdown. Scope, method and limitations
|
| Eggs |
Eggs: 7.2 kg per person per year, without conversion to egg counts. Scope, method and limitations
|
| Milk and dairy products |
Milk, published category: 2.6 kg per person per year; cheese and yoghurt are not broken down. Scope, method and limitations
|
| Protein sources |
In the cohort, mean protein contributions were cereals and products 37.20%; legumes, nuts, seeds and products 18.02%; fish, shellfish, other aquatic animals and products 9.56%. Eggs and products: 7.11%; milk and products: 1.8%. Scope, method and limitations
|
Fats, flavours and condiments
3/3
| Indicator | Findings and context |
|---|---|
| Cooking fats |
Palm oil 9.5, coconut oil 0.4 and other oils 0.4 kg per person per year in the published categories. Scope, method and limitations
|
| Herbs and spices |
Ginger, lemongrass and galangal each occur in 2 of the 6 sampled recipes. Scope, method and limitations
|
| Sauces and condiments |
Interviews describe sambal as a hot chilli sauce sometimes containing terasi, fermented shrimp paste, as a meal accompaniment. Scope, method and limitations
|
Meal composition
6/6
| Indicator | Findings and context |
|---|---|
| Breakfast composition |
Among breakfast consumers, 74.9% reported cereal grains, mainly rice; 34.5% vegetables; and 33.3% legumes. Scope, method and limitations
|
| Main meal composition |
For usual lunch, 75.3% selected rice with side dishes and 12.1% a shared menu. Scope, method and limitations
|
| Dinner composition |
For usual dinner, 64.3% selected rice with side dishes and 15.3% a shared menu. Scope, method and limitations
|
| Appetisers and snacks |
On the recalled day, 31.1% had one between-meal snack and 27.9% two. Scope, method and limitations
|
| Desserts and sweets |
Sumberwringin klepon are glutinous-rice-flour balls filled with gula merah and coated in grated coconut. Scope, method and limitations
|
| Portion sizes |
In the breakfast table, eggs and egg products have 182 consumers and a published median quantity of 60 g. Scope, method and limitations
|
Techniques and equipment
5/5
| Indicator | Findings and context |
|---|---|
| Cooking techniques |
Household diaries in South Jakarta recorded boiling, frying, stir-frying and steaming. Scope, method and limitations
|
| Vegetable preparation |
Gado-gado appears as a steamed vegetable salad with spicy peanut sauce in the interview examples. Scope, method and limitations
|
| Food preservation |
Pickles are described with cucumber, carrot, shallot and chilli, sometimes pineapple, marinated in a sweet-and-sour sugar-and-vinegar mixture. Scope, method and limitations
|
| Fermented foods |
Soybean tempe is made by fermenting beans with Rhizopus oligosporus or similar moulds; mycelium binds the beans into a compact mass. Scope, method and limitations
|
| Kitchen equipment |
Among electrified households, published estimated ownership was refrigerator 69%, rice cooker 69%, electric oven 0.7% and microwave 0.5%. Scope, method and limitations
|
Drinks
3/3
| Indicator | Findings and context |
|---|---|
| Everyday drinks |
Water supplied 80% of adults’ total beverage volume; 61% consumed a sugar-sweetened beverage during the recorded week. Scope, method and limitations
|
| Coffee and tea preparation |
In the Sidoarjo example, kopi tubruk is made by pouring hot water onto finely ground coffee and stirring without a filter. In Tegal, moci brews tea in an earthenware pot and adds rock sugar. Scope, method and limitations
|
| Drinks with meals |
Water drunk during main meals had a median of 493 mL/day, with 25th–75th percentiles of 245–773 mL/day. Scope, method and limitations
|
Nutrition and dietary patterns
3/3
| Indicator | Findings and context |
|---|---|
| Energy and nutrients |
Observed means per person per day: energy 1675 kcal, carbohydrate 243.9 g, fat 52.9 g and protein 61.2 g. Scope, method and limitations
|
| Salt and sugars |
The survey analysis estimated mean sodium intake at 2764 mg per person per day. Scope, method and limitations
|
| Dietary patterns |
In the sample, 87% ate both animal and plant foods, 11% were trying to reduce animal foods and 2% described themselves as vegetarian. Scope, method and limitations
|
Shopping, prices and waste
7/7
| Indicator | Findings and context |
|---|---|
| Food expenditure |
The statistical food, beverage and tobacco category totalled 775516 IDR per person per month, including 91708 IDR for cigarettes and tobacco. Scope, method and limitations
|
| Cost of a common basket |
A fixed basket of rice (5 kg), oil (2 L) and sugar (1 kg) had an announced value of 128500 IDR and a subsidised price of 15000 IDR per bundle. Scope, method and limitations
|
| Cost of specific meals |
A basic nasi goreng serving cost 4000 IDR at Lasmiati’s warung in Sugiharjo, Pati. Scope, method and limitations
|
| Grocery shopping locations |
Supermarkets and traditional markets appear among the shopping places reported by independent urban shoppers. Scope, method and limitations
|
| Shopping frequency |
Among urban respondents doing their own shopping, the most common answer was shopping once a week. Scope, method and limitations
|
| Prepared food and delivery |
Of respondents, 49% reported ordering snacks through apps, 33% beverages and 31% breakfast. Scope, method and limitations
|
| Household food waste |
The annualised estimate for Bogor households was 77 kg per person per year: 29 kg edible and 48 kg inedible. Scope, method and limitations
|
Seasons and celebrations
2/2
| Indicator | Findings and context |
|---|---|
| Seasonal produce |
In Probolinggo, the main mango harvest usually falls in October and November; the subsequent harvest is more limited. Scope, method and limitations
|
| Celebration food |
Gebyar Ketupat in Gorontalo is celebrated on 8 Shawwal, one week after Idul Fitri, with ketupat and dodol. Scope, method and limitations
|
Explore its cuisinesRead as an article ↗
Indonesia: West Sumatra, East Java and Bali
Documentary synthesis prepared with AI assistance. It does not replace specialist review or certify kitchen testing. · Updated 2 November 2026
An archipelago of repertoires
Indonesia's cuisines change between islands, communities and cities. The current catalogue offers rendang, nasi goreng, soto ayam and klepon. This selection provides a starting point for studying stews, rice, soups and sweets, rather than a complete representation of such a diverse archipelago. The guide proposes three documented routes that help identify regional differences.
The same family name can cover several compositions. Soto does not designate a single broth; rice served with accompaniments can bring together different ingredients and seasonings. A regional reading helps identify the version, while the recipe establishes the quantities and operations to be cooked.
Three regional routes
West Sumatra: rendang and Minangkabau culture
Padang rendang belongs to the documented culinary heritage of Minangkabau culture. Its prolonged cooking transforms meat and seasonings into a concentrated preparation. The relationship between time, liquid and finish forms part of its identity. The catalogue's dry rendang offers a way to explore this structure; the guide preserves its cultural context without treating all published versions bearing the same name as identical.
East Java: the precision of Lamongan soto
Lamongan soto is documented as a chicken soup with yellow broth and accompaniments, including koya, a powder made with prawn crackers. The documentation also records its spread through vendors from Lamongan. This example shows how a recipe can carry a place name to other cities. The catalogue's soto ayam retains its Indonesian attribution: it is not given the name Lamongan unless the particular version supports it.
Bali: seasonings and ways of serving accompaniments
Bali's documented repertoire includes betutu, sate lilit and lawar. These preparations offer ways to observe slow cooking, mixtures formed around a support, and combinations of vegetables, coconut and other ingredients. Diversity also appears in the ways rice is served with different accompaniments. The island cannot be reduced to one ceremonial dish, and not every mixture of coconut and spices is a Balinese version.
Cooking, reduction and organisation
Rendang and soto allow comparison of two relationships with liquid. For one, the focus is on following concentration; for the other, it is on understanding broth and accompaniments. Organising aromatics and seasonings before starting helps keep the stages distinct. If you use a prepared mixture, check its ingredients and the adjustment proposed in the recipe. Sharing a spice does not make two preparations direct substitutes.
Rice and sweets to extend the route
Nasi goreng adds a stir-frying technique, while klepon provides another way to work with a sweet dough. Choosing one preparation from each family extends the repertoire through specific operations. Before cooking, identify the condition of the rice and the characteristics of the flour stated in the recipe: both influence texture. The map opens cultural and territorial questions; the recipe keeps the version you can prepare today visible.
Names for recognising structures
- Rendang: a concentrated preparation with prolonged cooking, associated in the documentation with Minangkabau culture.
- Soto: a family of soups; the name needs the detail of a version to specify broth and accompaniments.
- Koya: a powder associated with prawn crackers in the documentation of Lamongan soto.
- Klepon: a sweet in the catalogue that offers a way to explore dough with its own texture and finish.
Liquid is also a culinary decision
Rendang and soto offer a clear contrast: concentrating a preparation and building a broth are different objectives. In the first, cooking transforms liquid and seasoning; in the second, attention turns to how broth, pieces and accompaniments come together in the bowl. Nasi goreng adds another route centred on rice and stir-frying. Recognising these objectives helps organise the ingredients before starting.
Trades that carry a name to other cities
The documentation of Lamongan connects local soto with vendors who spread their preparation. Cooking travels with those who make it, as well as with ingredients. Rendang's Minangkabau context and Balinese repertoires add other relationships between food, community and territory. Each name offers a way to follow a particular history within a large archipelago.
A route through three techniques
Explore reduction, broth and sweet dough in separate sessions with rendang, soto ayam and klepon. The sequence changes texture and work organisation: a concentrated stew, an arrangement of broth and accompaniments, and a shaped bite. Keep the detail of the recipe you cook and use regional sources to continue learning. This route offers contrasts from the catalogue, not a menu shared by all islands.
From territory to the current recipe collection
The linked dry rendang and soto ayam offer ways to study concentration and broth. The catalogue also includes nasi goreng and klepon. The recipes are associated with Indonesia, and the routes explain their regional contexts; a preparation is not given a local name simply because it belongs to the same family of dishes.
Timing and company
Meal times. Breakfast, lunch and dinner peaked at 7.00, 12.00 and 19.00 h respectively, in reported local time.
Meals per day. 52.1% reported three main meals on the recalled day and 32.1% two; snacks are not included.
Eating together. 65.3% ate breakfast alone and 54.4% dinner.
Adults in six Indonesian provinces; weighted sample of 1665 people. February–July 2018; West Sumatra, Jakarta, West Java, East Java, Bali and South Sulawesi. Face-to-face cluster survey and previous-day recall; weighting by population, residence, age and sex. Partial six-province coverage; does not represent areas east of the Wallace line. One day does not measure individual annual habits.
Daily energy distribution. Breakfast contributed approximately 26% of daily energy.
Adults in six Indonesian provinces; weighted sample of 1333 people. Survey labelled 2018; the paper dates collection to December 2017–March 2018, unlike February–July 2018 in the general report. Single-day recall; first intake before 10 a.m. exceeding 50 kcal; implausible intakes excluded. Partial breakfast coverage, not other meals or recommended requirements; six provinces. Conflicting publication fieldwork dates retained.
Weekdays and weekends. Interviews describe weekend changes in timing, meal counts and portions, varying with work.
Eating at home and away. Interviewed office workers describe eating bought or home-packed food at work, and breakfast or dinner at home.
December 2017–March 2018; local urban coverage. Partial local description; no national percentages or per-meal durations.
Cooking frequency. 57.8% of people responsible for cooking in the Indonesian sample reported preparing breakfast every weekday.
People responsible for cooking in the Indonesian sample, not the whole population. 2024/2025 series; page updated March 2026. Single-answer question about cooking breakfast at home on weekdays. Partial: weekday breakfast only. Public page gives no sample size, ages, weights or exact fieldwork dates; no preparation minutes or total weekly cooking days.
Pantry and recipes
Most consumed ingredients. Published quantities: rice 92.1, vegetables 52.1 and fruit 37.2 kg per person per year. Selected categories, not an exhaustive ranking.
Indonesia national population; per-person average from the official series. Observation year 2024; kg per person per year in the published standardised form. Official food grouping and producer conversion to homogeneous forms, types and units; published figures without additional conversions. Partial category coverage; not cooked portion weights or individually weighed intake. Page does not detail conversion factors or underlying sample; do not equate with purchases, food-balance availability or unstandardised series.
Ingredient prevalence in recipes. Water present in 4 of 6 recipes; garlic in 3 of 6 and salt in 3 of 6.
The six Indonesian recipes published in the catalogue at collection time. Snapshot dated 1 November 2026, Spain local time. Presence counts by exact ingredient ID, once per canonical recipe; translations and repeated rows not duplicated. Culinary variants retained. Small editorial catalogue sample; does not represent all Indonesian recipes, household frequency or intake. Ingredients not merged by name similarity.
Cereals and plant foods
Cereals and cereal products. Rice 92.1, wheat/wheat flour 16.1 and maize 1.5 kg per person per year, in the series’ standardised forms.
Pulses. Soybean 9.1, peanut 0.3 and mung bean 0.4 kg per person per year, in published standardised forms, without conversion to cooked weight.
Vegetables. Vegetables: 52.1 kg per person per year; the table groups species together.
Fruit. Fruit: 37.2 kg per person per year; this table has no species breakdown.
Potatoes, roots and tubers. Cassava 8.5, sweet potato 3.1, potato 2.5 and sago 0.6 kg per person per year, following the published categories.
Indonesia national population; per-person average from the official series. Observation year 2024; kg per person per year in the published standardised form. Official food grouping and producer conversion to homogeneous forms, types and units; published figures without additional conversions. Partial category coverage; not cooked portion weights or individually weighed intake. Page does not detail conversion factors or underlying sample; do not equate with purchases, food-balance availability or unstandardised series.
Bread. One Jakarta participant described bread as an alternative to rice within a meal; this is a local testimony.
December 2017–March 2018; local urban coverage. Partial qualitative coverage: no quantities, bread types or national prevalence.
Protein foods
Meat. Ruminant meat: 3.3; poultry: 9.9 kg per person per year in the published standardised form.
Indonesia national population; per-person average from the official series. Observation year 2024; kg per person per year in the published standardised form. Official food grouping and producer conversion to homogeneous forms, types and units; published figures without additional conversions. Partial category coverage; not cooked portion weights or individually weighed intake. Page does not detail conversion factors or underlying sample; do not equate with purchases, food-balance availability or unstandardised series. Carcass versus edible weight is not specified; other meats are not broken down.
Fish and seafood. Fish: 22.5 kg per person per year; no species or fresh-versus-preserved breakdown.
Eggs. Eggs: 7.2 kg per person per year, without conversion to egg counts.
Milk and dairy products. Milk, published category: 2.6 kg per person per year; cheese and yoghurt are not broken down.
Indonesia national population; per-person average from the official series. Observation year 2024; kg per person per year in the published standardised form. Official food grouping and producer conversion to homogeneous forms, types and units; published figures without additional conversions. Partial category coverage; not cooked portion weights or individually weighed intake. Page does not detail conversion factors or underlying sample; do not equate with purchases, food-balance availability or unstandardised series.
Protein sources. In the cohort, mean protein contributions were cereals and products 37.20%; legumes, nuts, seeds and products 18.02%; fish, shellfish, other aquatic animals and products 9.56%. Eggs and products: 7.11%; milk and products: 1.8%.
Observation period: 2011–2019. 867 adults aged at least 25 in an Indonesian cohort, purposively selected for complete data at every visit. Visits in 2011, 2013, 2015, 2017 and 2019; published mean percentage contributions to estimated protein intake. One-day food recall per visit; nutrient estimation using TKPI and ASEAN composition tables and NutriSurvey. Protein-contribution table, not eating-event frequencies. Purposive cohort sample, not a nationally representative estimate. Partial food-group coverage; individual variability and recall error. Does not establish recommendations or causal effects.
Fats, flavours and condiments
Cooking fats. Palm oil 9.5, coconut oil 0.4 and other oils 0.4 kg per person per year in the published categories.
Indonesia national population; per-person average from the official series. Observation year 2024; kg per person per year in the published standardised form. Official food grouping and producer conversion to homogeneous forms, types and units; published figures without additional conversions. Partial category coverage; not cooked portion weights or individually weighed intake. Page does not detail conversion factors or underlying sample; do not equate with purchases, food-balance availability or unstandardised series.
Herbs and spices. Ginger, lemongrass and galangal each occur in 2 of the 6 sampled recipes.
The six Indonesian recipes published in the catalogue at collection time. Snapshot dated 1 November 2026, Spain local time. Presence counts by exact ingredient ID, once per canonical recipe; translations and repeated rows not duplicated. Culinary variants retained. Small editorial catalogue sample; does not represent all Indonesian recipes, household frequency or intake. Ingredients not merged by name similarity.
Sauces and condiments. Interviews describe sambal as a hot chilli sauce sometimes containing terasi, fermented shrimp paste, as a meal accompaniment.
December 2017–March 2018; local urban coverage. Partial local qualitative description; no national frequency, standardised recipes or quantities consumed.
Meal composition
Breakfast composition. Among breakfast consumers, 74.9% reported cereal grains, mainly rice; 34.5% vegetables; and 33.3% legumes.
1263 adult breakfast consumers from six Indonesian provinces after excluding implausible energy intakes. Survey labelled 2018; the paper dates collection to December 2017–March 2018, unlike February–July 2018 in the general report. Single-day recall; first intake before 10 a.m. exceeding 50 kcal; implausible intakes excluded. Partial one-day, six-province coverage. Frequency among breakfast consumers, not the whole population or annual habits; groups may occur together in one breakfast.
Main meal composition. For usual lunch, 75.3% selected rice with side dishes and 12.1% a shared menu.
1532 responses on usual lunch in the six-province survey. February–July 2018; West Sumatra, Jakarta, West Java, East Java, Bali and South Sulawesi. Food-card selection for usual and perceived proper menus; only the table’s usual-meal column is used. Responses about usual structure, not weighed dishes or nutritional recommendations. Six provinces; does not establish a uniform national pattern or lunch as invariably the largest meal.
Dinner composition. For usual dinner, 64.3% selected rice with side dishes and 15.3% a shared menu.
1517 responses on usual dinner in the six-province survey. February–July 2018; West Sumatra, Jakarta, West Java, East Java, Bali and South Sulawesi. Food-card selection for usual and perceived proper menus; only the table’s usual-meal column is used. Responses about usual structure, not weighed dishes or nutritional recommendations. Six provinces; does not establish a uniform national pattern or lunch as invariably the largest meal.
Appetisers and snacks. On the recalled day, 31.1% had one between-meal snack and 27.9% two.
Adults in six Indonesian provinces; weighted sample of 1665 people. February–July 2018; West Sumatra, Jakarta, West Java, East Java, Bali and South Sulawesi. Face-to-face cluster survey and previous-day recall; weighting by population, residence, age and sex. Partial six-province coverage; does not represent areas east of the Wallace line. One day does not measure individual annual habits.
Desserts and sweets. Sumberwringin klepon are glutinous-rice-flour balls filled with gula merah and coated in grated coconut.
Cultural description without a published observation date; consulted November 2026. Partial qualitative coverage of a local sweet; no national frequency or claim that it is eaten after meals. Gula merah is retained without inferring its raw material.
Portion sizes. In the breakfast table, eggs and egg products have 182 consumers and a published median quantity of 60 g.
1263 adult breakfast consumers from six Indonesian provinces after excluding implausible energy intakes. Survey labelled 2018; the paper dates collection to December 2017–March 2018, unlike February–July 2018 in the general report. Single-day recall; first intake before 10 a.m. exceeding 50 kcal; implausible intakes excluded. Published total quantity for a food group at breakfast, estimated from recall and photographs; not weight per egg or a recommended or standardised serving. Do not extrapolate to all residents or meals.
Techniques and equipment
Cooking techniques. Household diaries in South Jakarta recorded boiling, frying, stir-frying and steaming.
Methods date the study to March–June 2023, but a first-phase table header says 2022; detailed dates conflict. Partial descriptive coverage, small sample and technology intervention. No national percentages or reconciliation of conflicting dates.
Vegetable preparation. Gado-gado appears as a steamed vegetable salad with spicy peanut sauce in the interview examples.
Interviews and focus groups in Jakarta, Denpasar and Makassar. December 2017–March 2018; local urban coverage. Qualitative interviews and focus groups. Partial local qualitative example of one preparation; does not measure national raw/cooked vegetable shares by method.
Food preservation. Pickles are described with cucumber, carrot, shallot and chilli, sometimes pineapple, marinated in a sweet-and-sour sugar-and-vinegar mixture.
December 2017–March 2018; local urban coverage. Partial culinary description; no verified preservation frequency, times or acidity. Does not establish sterilisation or room-temperature stability.
Fermented foods. Soybean tempe is made by fermenting beans with Rhizopus oligosporus or similar moulds; mycelium binds the beans into a compact mass.
Technical description without a stated observation year; consulted November 2026. Partial coverage of one fermented food; no national frequency or validated home-production protocol.
Kitchen equipment. Among electrified households, published estimated ownership was refrigerator 69%, rice cooker 69%, electric oven 0.7% and microwave 0.5%.
5443 visited households in urban and rural areas across 34 provinces; projection to electrified households. Collection September–December 2019 according to the appendix timeline; later analysis and publication in 2020. Face-to-face interviews and visits, multistage sampling and province/urban-rural weighted projection; table ownership column. Historical electrified-household data, not all households or current estimates. Published rounded percentages retained; does not measure use for individual preparations or pressure-cooker ownership.
Drinks
Everyday drinks. Water supplied 80% of adults’ total beverage volume; 61% consumed a sugar-sweetened beverage during the recorded week.
2778 adults aged 18–65 with complete diaries; adult subsample of the Indonesian study. May 2016; 32 cities across nine Indonesian regions. Seven-day beverage diary with illustrated containers; household quota recruitment, without weighting. Partial historical self-report; excludes water in food. The first percentage is volume, the second people, not daily frequency. Unweighted quota sample. Authors report employment or consultancy links with Danone.
Coffee and tea preparation. In the Sidoarjo example, kopi tubruk is made by pouring hot water onto finely ground coffee and stirring without a filter. In Tegal, moci brews tea in an earthenware pot and adds rock sugar.
Pages consulted November 2026; the moci catalogue describes a 2018 publication, without a stated observation period. Partial local qualitative coverage; no national percentages, cup size, sugar dose or frequency of adding milk.
Drinks with meals. Water drunk during main meals had a median of 493 mL/day, with 25th–75th percentiles of 245–773 mL/day.
3644 Indonesian participants aged 4–65; statistic for the full sample, including non-consumers. May 2016; 32 cities across nine Indonesian regions. Seven-day beverage diaries; daily sum during breakfast, lunch and dinner, separate from drinks between meals or without food. Partial coverage: daily water volume during meals, not glass size or percentage of people. Historical self-report and unweighted quotas. Authors report employment or consultancy links with Danone.
Nutrition and dietary patterns
Energy and nutrients. Observed means per person per day: energy 1675 kcal, carbohydrate 243.9 g, fat 52.9 g and protein 61.2 g.
145360 analysed individuals of all ages from 45802 households in the national study. National individual consumption in 2014; reports for 33 provinces, with North Kalimantan included in East Kalimantan. Main previous-day recall and food-composition tables; arithmetic means using the entire sample as denominator. Partial historical coverage: no verified fibre figure included. These are not recommendations, food supply or usual annual intake; recall and composition errors are possible.
Salt and sugars. The survey analysis estimated mean sodium intake at 2764 mg per person per day.
Analysis of 145360 people in 33 Indonesian provinces; the abstract does not detail the age distribution. SKMI 2014 data; reanalysis published in Gizi Indonesia and summarised by its authors. Descriptive analysis of a 24-hour food recall; original authors abstract read in the official repository. Partial sodium coverage, without conversion to salt. No verified total, added or free sugar intake supplied. One recall day does not measure individual usual intake or equal urinary excretion.
Dietary patterns. In the sample, 87% ate both animal and plant foods, 11% were trying to reduce animal foods and 2% described themselves as vegetarian.
1614 Indonesian respondents; age profile and sampling frame are not detailed in the consulted release. Survey on 18–19 July 2023; results and dates published by the research provider. Self-reported release categories: eating both sources, reducing animal foods or vegetarian. The release defines vegetarianism as a diet without animal-based foods. Partial commercial-survey coverage, not established national prevalence. No separate vegan estimate or reduction threshold; its vegetarian category is not directly comparable to definitions allowing eggs or dairy. Weighting is not detailed.
Shopping, prices and waste
Grocery shopping locations. Supermarkets and traditional markets appear among the shopping places reported by independent urban shoppers.
Report published 15 November 2016; fieldwork dates are not stated on the consulted page. Partial qualitative coverage of reported places; does not measure expenditure shares by channel or represent all Indonesia or the current market.
Shopping frequency. Among urban respondents doing their own shopping, the most common answer was shopping once a week.
Report published 15 November 2016; fieldwork dates are not stated on the consulted page. Historical qualitative coverage: modal answer, not mean visits or average basket spend. Fieldwork dates unspecified.
Prepared food and delivery. Of respondents, 49% reported ordering snacks through apps, 33% beverages and 31% breakfast.
1343 Indonesian respondents in the provider report; profile and selection are not detailed in the release read. Survey of 13–14 March 2025 on ordering food through apps. Self-reported survey; original results release and original dates/sample page actually consulted. Partial coverage by order type, not weekly frequency or spend. Exact recall window is absent from the release; not all prepared-food consumption or national prevalence.
Household food waste. The annualised estimate for Bogor households was 77 kg per person per year: 29 kg edible and 48 kg inedible.
215 households in Bogor Regency: 150 urban Cibinong and 65 rural Sukajaya households. Measurements on 4–30 October 2022; regional results published in 2024. Multistage sampling; solids sorted and weighed over eight days and beverages recorded over seven. Annualisation and regional weighting performed by the authors. Partial local coverage, not a national estimate. Includes edible and inedible parts; excludes agricultural, retail and food-service losses. Short measurement and diaries may involve behavioural changes or omissions.
Food expenditure. The statistical food, beverage and tobacco category totalled 775516 IDR per person per month, including 91708 IDR for cigarettes and tobacco.
Indonesian household population, urban and rural areas; Susenas per-capita mean. March 2025 Susenas, Table 3.1; nominal Indonesian rupiah. Past-week consumption value converted to a month by BPS; total household consumption divided by the whole population, whether consuming each item or not. Partial coverage: broad category including tobacco, not food-only spending. Consumption value, not just cash purchases or nutritional intake. Does not represent current prices or regional differences.
Cost of a common basket. A fixed basket of rice (5 kg), oil (2 L) and sugar (1 kg) had an announced value of 128500 IDR and a subsidised price of 15000 IDR per bundle.
Recipients of Central Kalimantan’s Pasar Murah programme. Programme launched in Palangka Raya on 28 March 2025. Quantities and access price published by the administration organising the offer. Local subsidised example; not a national market basket or weekly household expenditure. Announced value and access price are different concepts; no individual transaction established.
Cost of specific meals. A basic nasi goreng serving cost 4000 IDR at Lasmiati’s warung in Sugiharjo, Pati.
One establishment in Dukuh Gilis, Sugiharjo, Pati Kota, Central Java. Price described as current in a report published on 4 February 2025; exact visit date unstated. Original on-site reporting with preparation observations and direct interviews with the owner and a customer. Partial local example of a quoted price, not a national average or home-cooking cost. Serving mass, taxes and service unspecified; extras excluded. Does not establish today’s price.
Seasons and celebrations
Seasonal produce. In Probolinggo, the main mango harvest usually falls in October and November; the subsequent harvest is more limited.
Usual calendar described in a municipal communication of 30 October 2026, not measurement of a particular crop year. Partial qualitative coverage of one fruit and area. Not a calendar of all foods, provinces or varieties, a production series or a guarantee of retail availability. Timing can vary with climate and crop management.
Celebration food. Gebyar Ketupat in Gorontalo is celebrated on 8 Shawwal, one week after Idul Fitri, with ketupat and dodol.
Recurring Islamic-calendar date; its Gregorian-calendar equivalent changes each year. Partial local cultural example, not a catalogue of all celebrations or regions. The page does not quantify attendance, servings or ingredients; it prescribes no recipe or uniform national menu.
Places and communities
One country, many cuisines
An initial selection of regions to explore. Culinary boundaries may differ from administrative divisions.
Java Oriental y Lamongan
Sumatra Occidental y Minangkabau
Cook
Recipes connected with Indonesia
Each recipe documents one version. Geographic associations do not imply an exclusive origin.
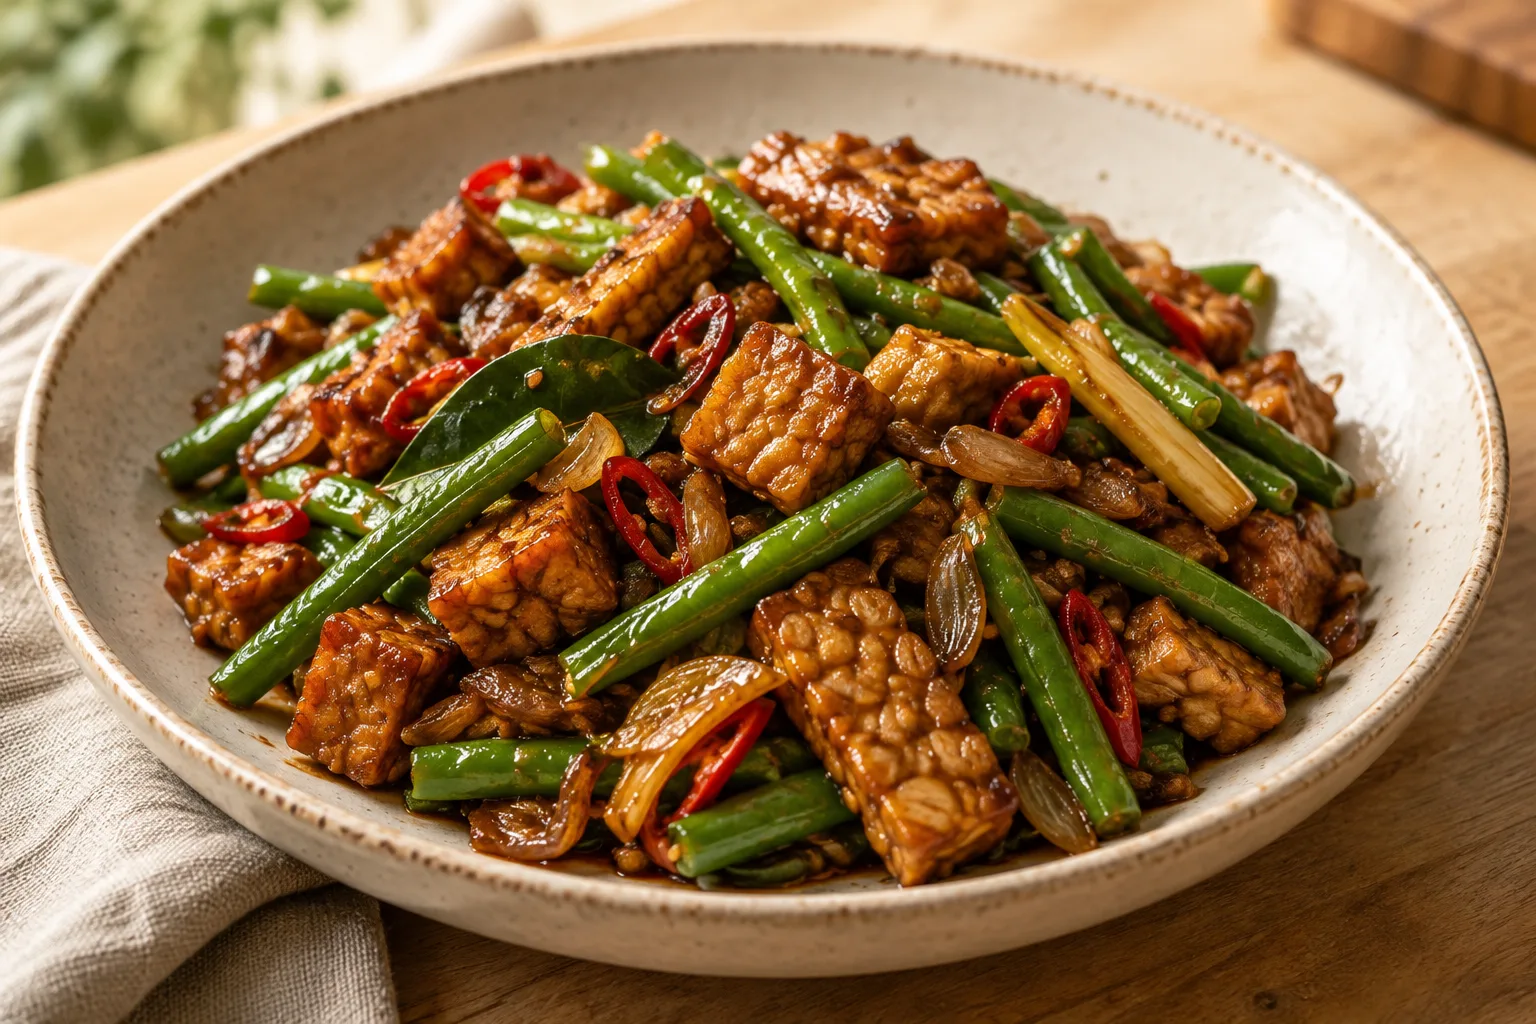
Tempeh orek with green beans
Golden tempeh and green beans stir-fried with shallots, garlic, chilli and lemongrass, then coated in kecap manis and tamarind. Makes 4 servings; timings are estimates.
View recipe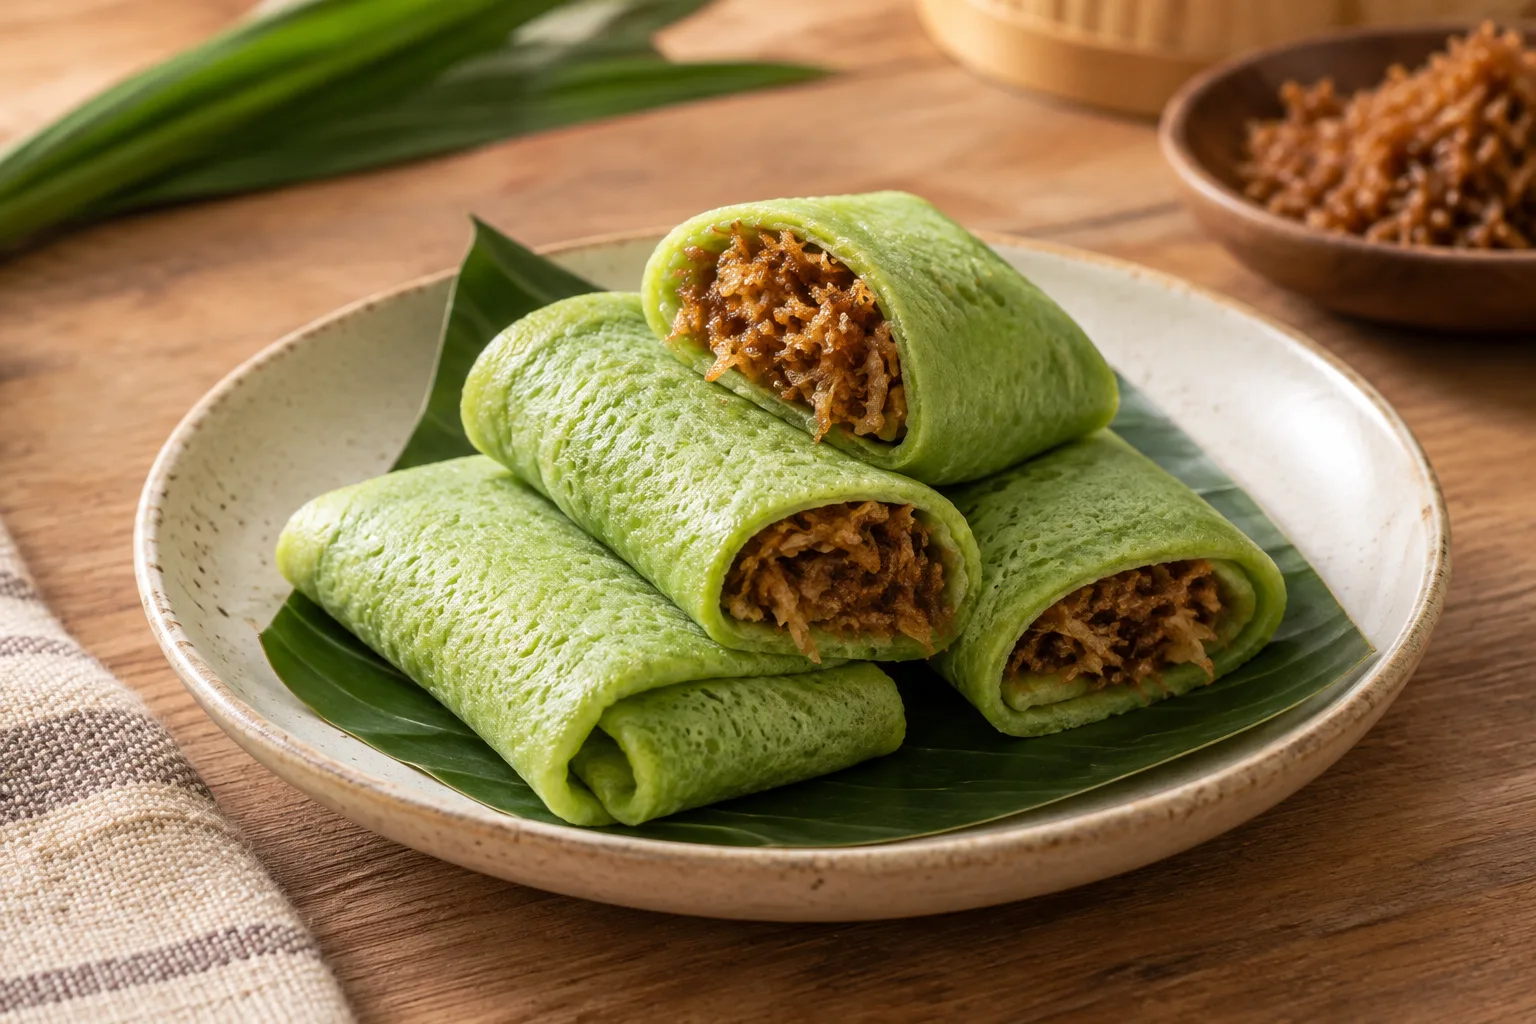
Dadar gulung
Thin pandan crêpes filled with grated coconut and palm sugar, folded and rolled. Serves 4; timings are estimates.
View recipe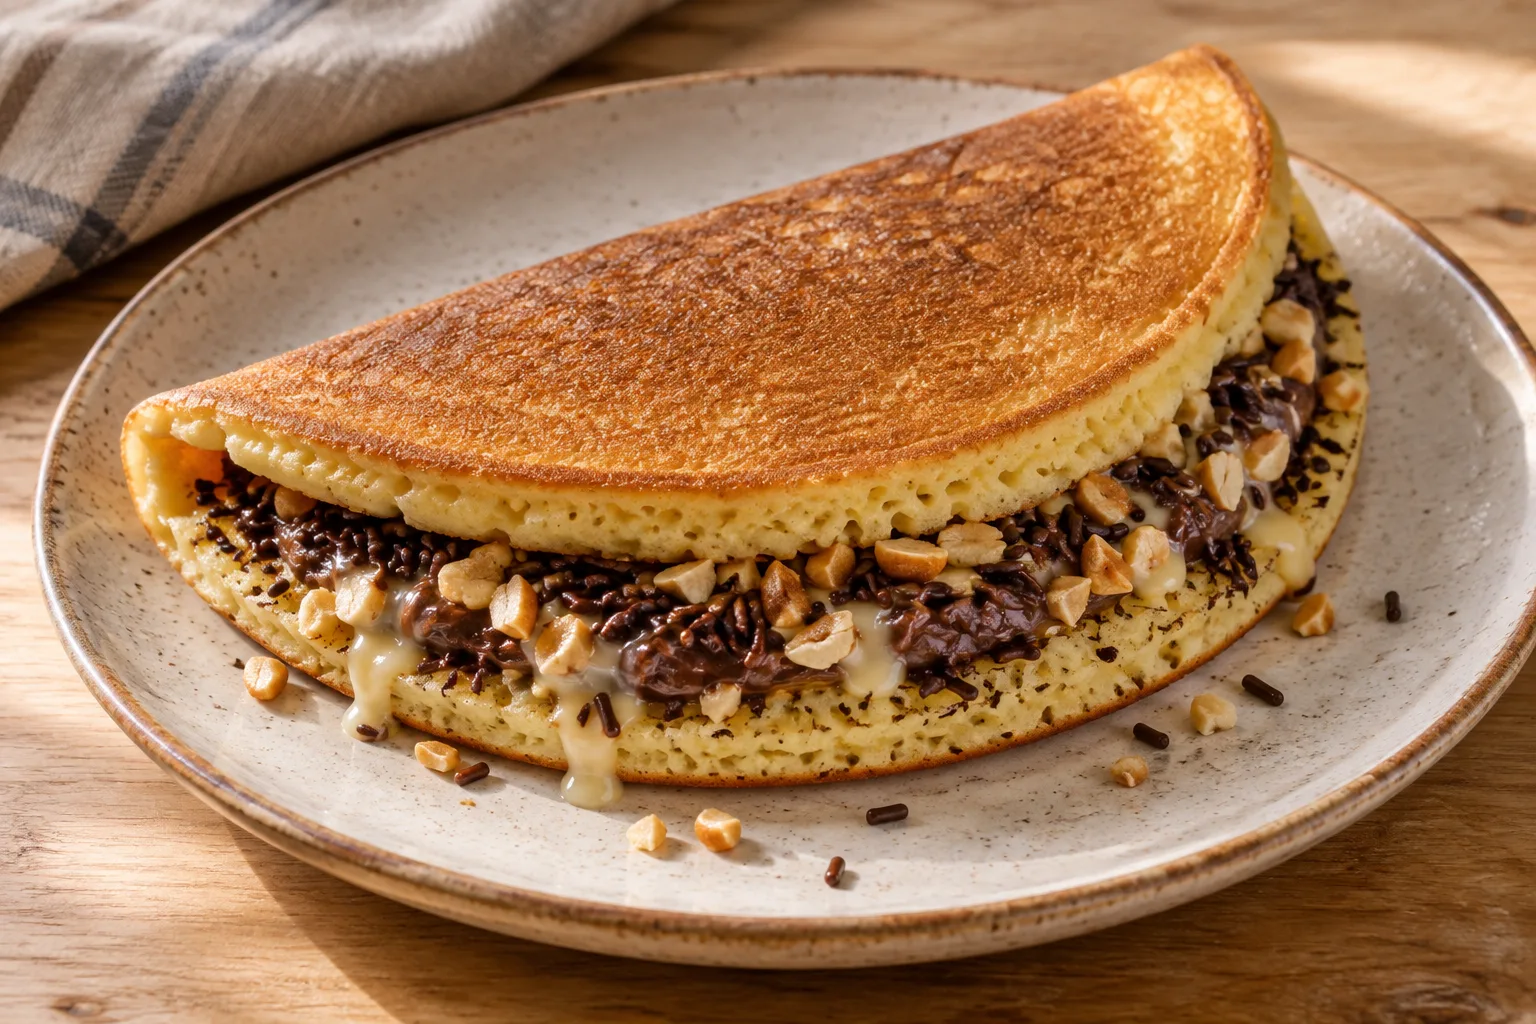
Martabak manis
A thick, airy Indonesian sweet pancake, cooked without flipping and folded with butter, condensed milk, chocolate, and peanuts.
View recipe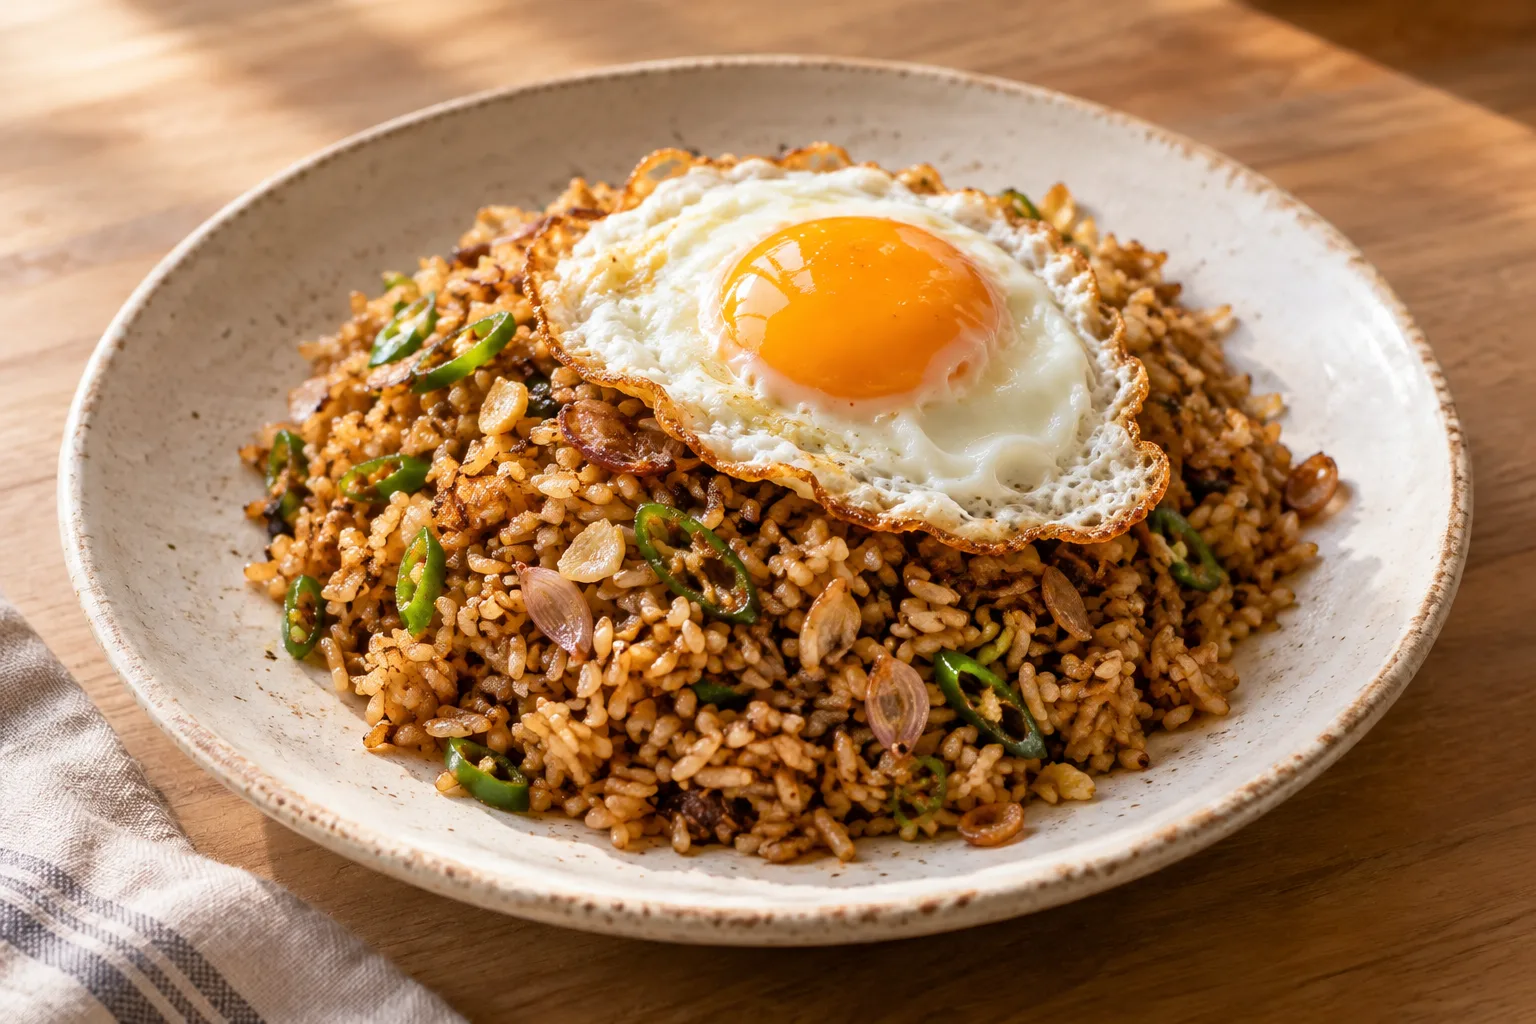
Indonesian nasi goreng with fried egg
Cold rice stir-fried with shallot, garlic, chili, terasi, kecap manis and soy sauce; served with a fried egg.
View recipe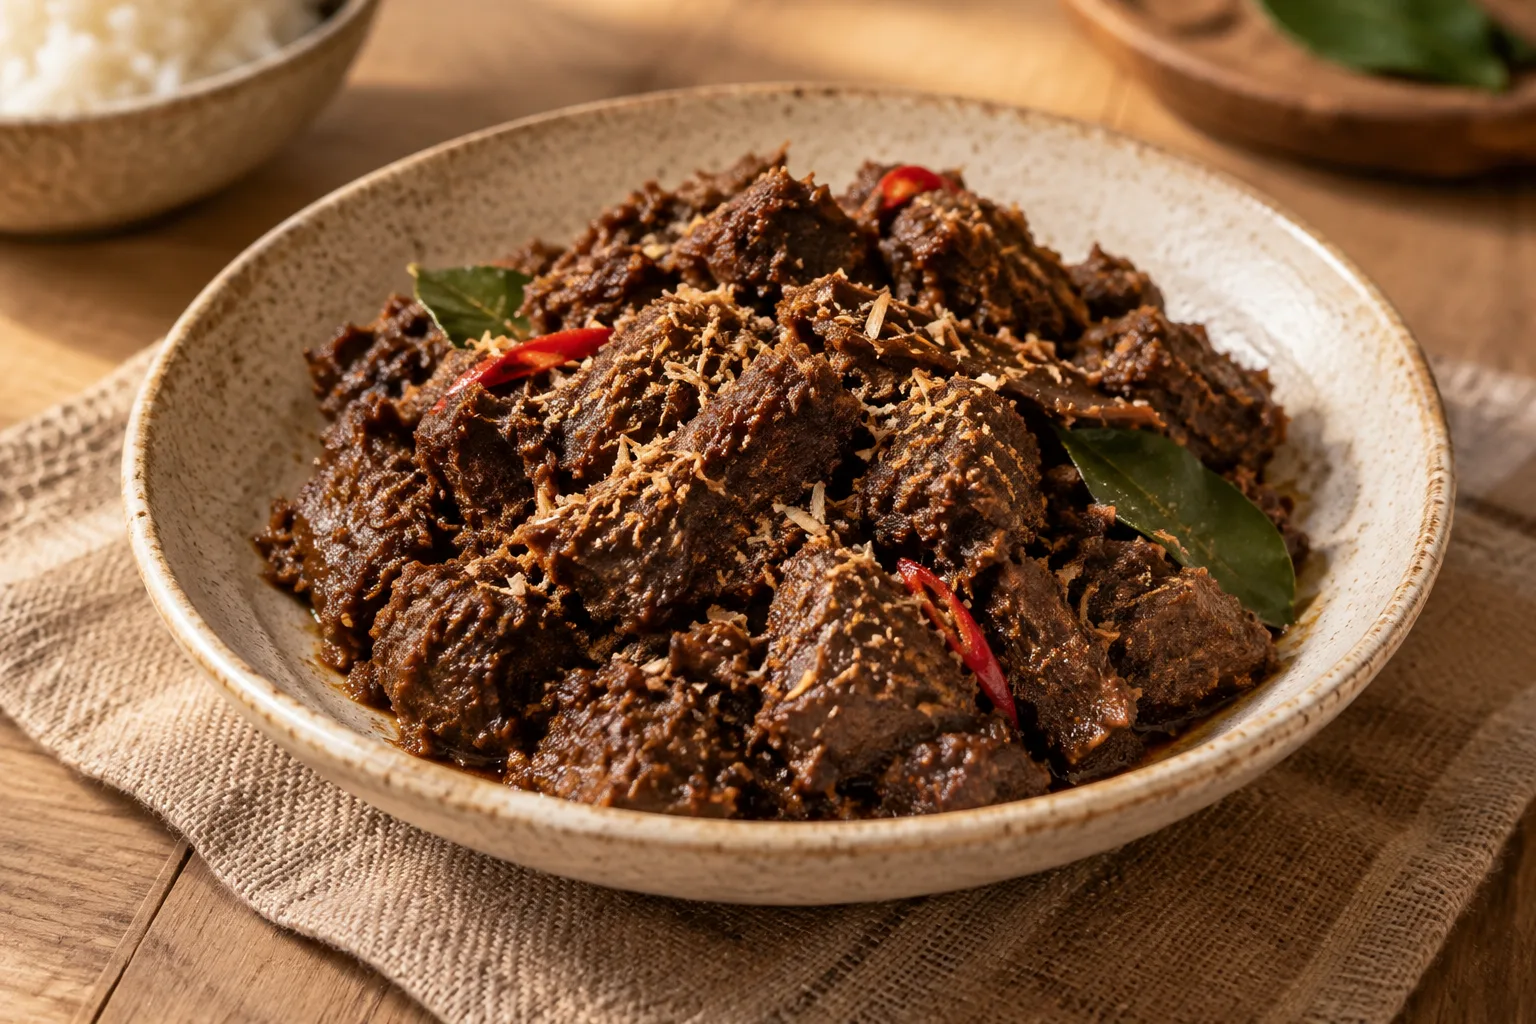
Dry beef rendang
Indonesian beef rendang slowly cooked with coconut milk, spices, and aromatic herbs until the liquid reduces and the meat is tender and dark.
View recipe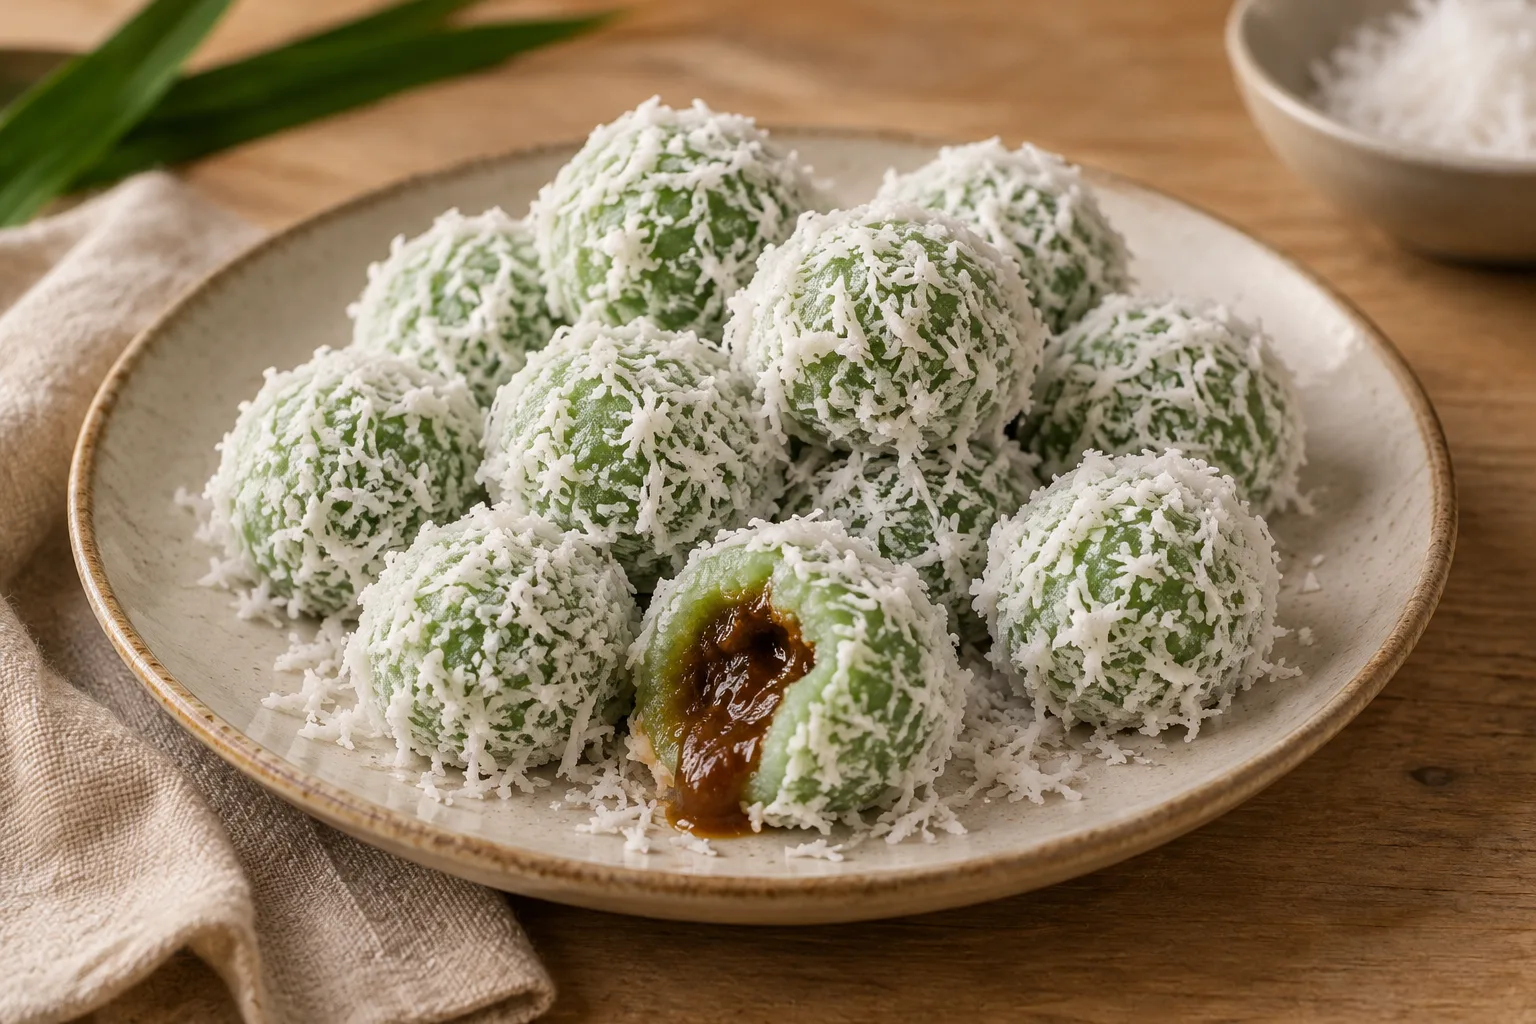
Indonesian Klepon
Indonesian glutinous-rice sweets filled with palm sugar and coated in grated coconut. This recipe makes approximately 12–14 pieces.
View recipe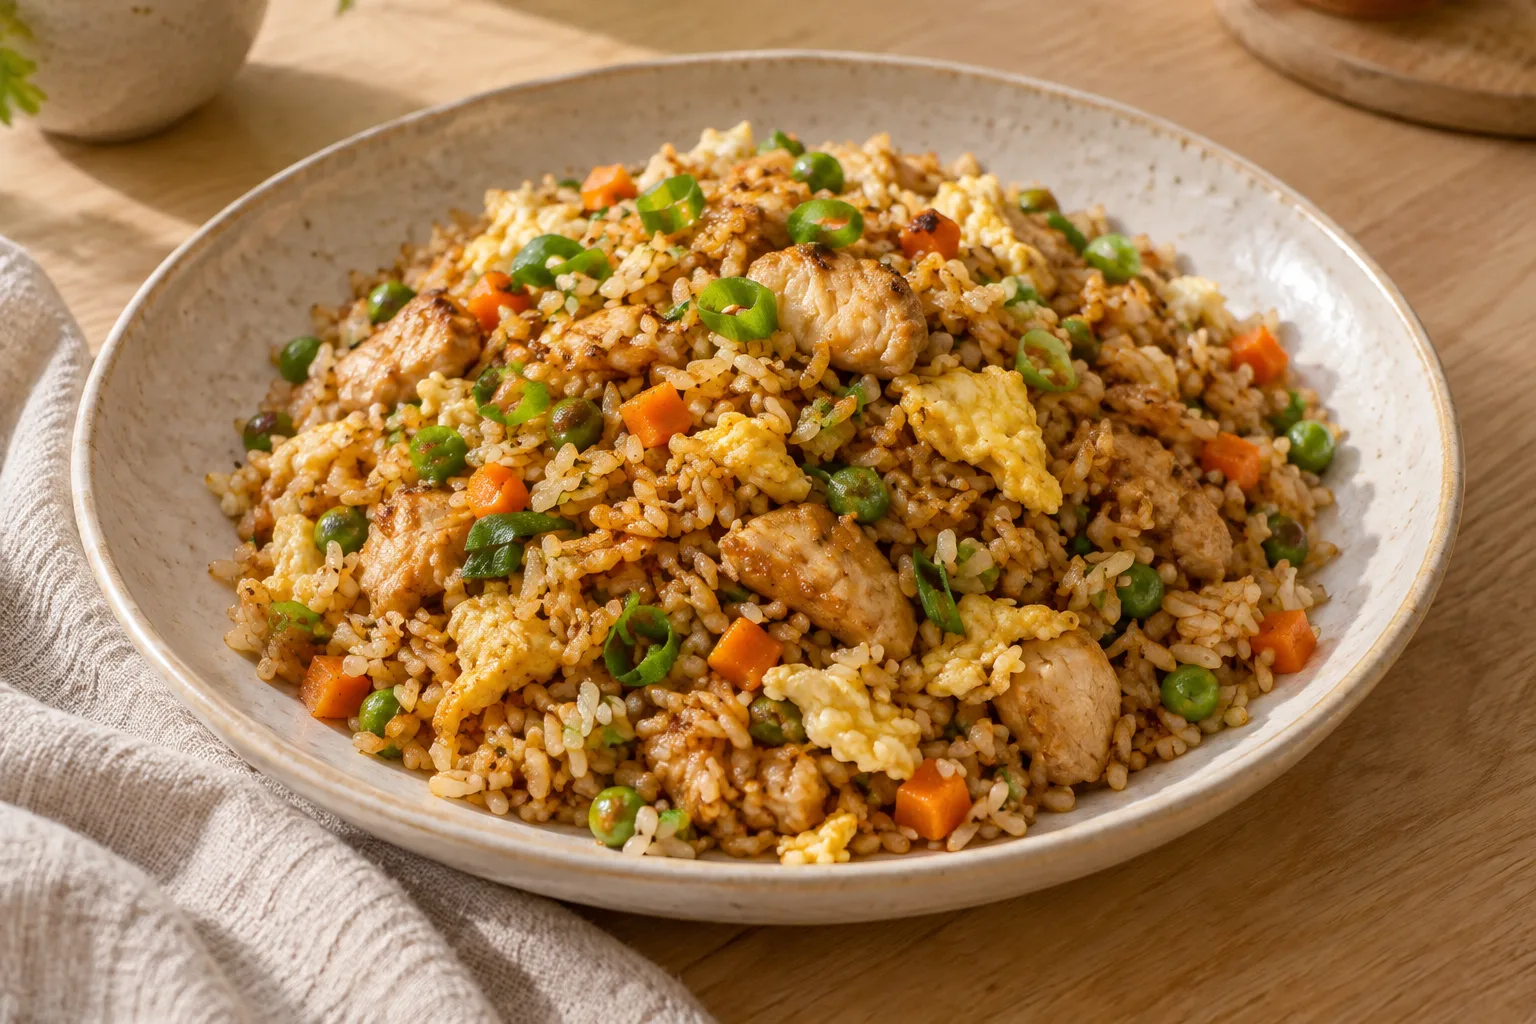
Indonesian Nasi Goreng with Chicken and Egg
Indonesian fried rice with chicken, egg, vegetables, and the sweet-salty combination of kecap manis and soy sauce.
View recipe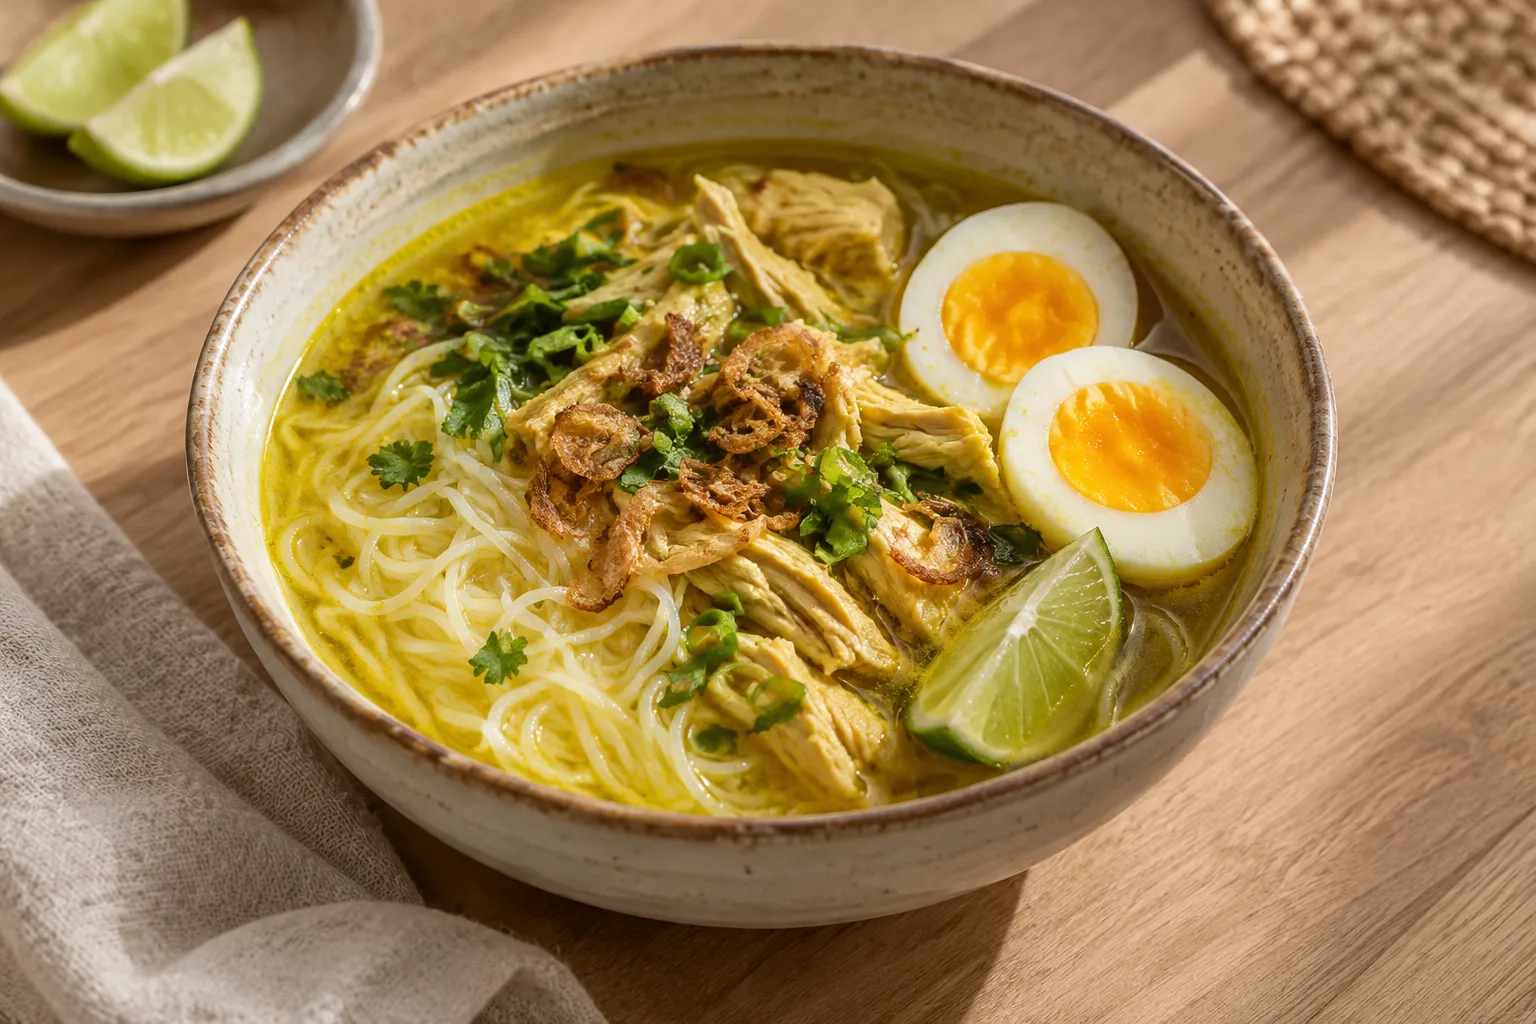
Soto ayam
Indonesian chicken soup with a yellow broth flavored with turmeric, galangal, ginger, and lemongrass, served with rice vermicelli, egg, and lime.
View recipe
Sources consulted
Read the sources and each document’s scope. A heritage inscription concerns a particular practice, not all of a country’s cuisine.
- Indonesian Food Barometer — Food, Cultures, and Health www.seameo-recfon.org/wp-content/uploads/Indonesian-Food-Barometer-Food-Cultures-Health.pdf SEAMEO RECFON Consulted: November 1, 2026
- Breakfast Consumption and Quality of Macro- and Micronutrient Intake in Indonesia pmc.ncbi.nlm.nih.gov/articles/PMC10489646/ Khusun et al.; Nutrients / PMC Consulted: November 1, 2026
- Frequency of cooking at home on weekdays: Breakfast — Global Viewer 2024/2025 www.global-market-surfer.com/market/detail/847?l=en INTAGE Inc. Consulted: November 1, 2026
- Rata-rata Konsumsi per Jenis Pangan Penduduk Indonesia Nasional Update Tahun 2024 data.badanpangan.go.id/datasetpublications/o5x/konsumsi_nasional Badan Pangan Nasional — Direktorat Penganekaragaman Konsumsi Pangan Consulted: November 1, 2026
- KitchenPause — Indonesian published recipe sample, 1 November 2026 www.kitchenpause.com/es/recetas?country=ID KitchenPause Consulted: November 1, 2026
- Contribution of Food, Energy, Macronutrients and Fiber Consumption Patterns to Obesity and Other Non-Communicable Disease Risks in the Indonesian Population pmc.ncbi.nlm.nih.gov/articles/PMC12073135/ Nutrients; original research archived in PMC Consulted: November 1, 2026
- Klepon — Desa Wisata Sumberwringin, Bondowoso, Jawa Timur jadesta.kemenpar.go.id/paket/klepon Desa Wisata Sumberwringin / Ministry of Tourism Jadesta Consulted: November 1, 2026
- The Indonesia Cooking Diaries Study www.iisd.org/system/files/2024-06/indonesia-cooking-diaries.pdf International Institute for Sustainable Development Consulted: November 1, 2026
- Tempe Kedelai — BRMP Pascapanen pascapanen.brmp.pertanian.go.id/layanan/layanan-lainnya/tempe-kedelai Indonesian Ministry of Agriculture, BRMP Pascapanen Consulted: November 1, 2026
- Indonesia Residential End Use Survey — Final Report www.clasp.ngo/wp-content/uploads/2021/01/Indonesia-Residential-End-Use-Survey.pdf CLASP and Ipsos Consulted: November 1, 2026
- Fluid intake of children, adolescents and adults in Indonesia: results of the 2016 Liq.In7 national cross-sectional survey link.springer.com/content/pdf/10.1007/s00394-018-1740-z.pdf European Journal of Nutrition — original research authors Consulted: November 1, 2026
- Kopi Tubruk — TukuoYuk Sidoarjo tukuoyuk.sidoarjokab.go.id/p/kopi-tubruk Sidoarjo Regency TukuoYuk; Warkop Mercy product description Consulted: November 1, 2026
- Tradisi Moci: Minum Teh di Tegal Jawa Tengah — institutional catalogue description pustaka.kemenbud.go.id/index.php?id=15938&keywords=&p=show_detail Indonesian Ministry of Culture, Ranggawarsita Library; Balai Pelestarian Nilai Budaya Yogyakarta Consulted: November 1, 2026
- A comparison of drinking behavior using a harmonized methodology (Liq.In7) in six countries link.springer.com/content/pdf/10.1007/s00394-018-1744-8.pdf European Journal of Nutrition — original research authors Consulted: November 1, 2026
- Buku Studi Diet Total: Survei Konsumsi Makanan Individu Indonesia 2014 www.badankebijakan.kemkes.go.id/repositori/id/eprint/4741/1/Laporan_SDT2014.pdf Indonesian Ministry of Health, Badan Litbangkes Consulted: November 1, 2026
- Asupan Natrium Penduduk Indonesia: Analisis Data Survei Konsumsi Makanan Individu (SKMI) 2014 garuda.kemdiktisaintek.go.id/documents/detail/887936 Prihatini, Permaesih and Julianti, Gizi Indonesia; authors abstract in Garuda official repository Consulted: November 1, 2026
- Does the Vegetarian Diet Support Frugal Living? — original survey release insight.jakpat.net/does-the-vegetarian-diet-support-frugal-living/ Jakpat Consulted: November 1, 2026
- Exploring the Vegetarian Trends in Indonesia — survey observation dates insight.jakpat.net/exploring-the-vegetarian-trends-in-indonesia/ Jakpat Consulted: November 1, 2026
- Grocery Shopping Pattern in Big Cities of Indonesia — Survey Report 2016 insight.jakpat.net/grocery-shopping-pattern-in-big-cities-of-indonesia-survey-report-2016/ Jakpat — original survey provider Consulted: November 1, 2026
- Online Food Delivery Trend Drops, Buyers Look for Discounts insight.jakpat.net/online-food-delivery-trend-drops-buyers-look-for-discounts/ Jakpat — original survey provider Consulted: November 1, 2026
- The quantity and composition of household food waste: Implications for policy journals.plos.org/plosone/article/file?id=10.1371/journal.pone.0305087&type=printable Martianto et al., PLOS ONE Consulted: November 1, 2026
- Pengeluaran untuk Konsumsi Penduduk Indonesia Maret 2025 www.bps.go.id/id/publication/2025/10/10/755ea866289ba29e5104e58d/pengeluaran-untuk-konsumsi-… Badan Pusat Statistik (BPS-Statistics Indonesia) Consulted: November 1, 2026
- Pasar Murah — fixed bundle and subsidised price, 28 March 2025 biroadpim.kalteng.go.id/gubernur-buka-pasar-murah-di-desa-desa-dan-bagikan-paket-sembako-unt… Biro Administrasi Pimpinan, Central Kalimantan provincial government Consulted: November 1, 2026
- Nasi goreng Lasmiati, Pati — original vendor interview kuliner.murianews.com/umar-hanafi/433079/murah-banget-nasi-goreng-di-pati-ini-cuma-rp-4-ribu… Umar Hanafi, Murianews Consulted: November 1, 2026
- Mango Carnival — local harvest calendar in Probolinggo infopublik.id/kategori/nusantara/995222/mango-carnival-pertemukan-penghasil-mangga-pemkot-pr… MC Kota Probolinggo, official municipal media centre; InfoPublik Consulted: November 1, 2026
- Gebyar Ketupat — Gorontalo culinary celebration www.indonesia.travel/id/id/muslim-friendly-travel/events/gebyar-ketupat Ministry of Tourism, Republic of Indonesia Consulted: November 1, 2026
- Rendang Padang, Duta Kuliner Indonesia yang Telah Mendunia www.indonesia.travel/gb/en/travel-ideas/gastronomy/rendang-padang Ministry of Tourism, Republic of Indonesia Consulted: October 31, 2026
- Soto Lamongan www.indonesia.travel/id/id/destination/java/east-java/soto-lamongan Ministry of Tourism, Republic of Indonesia Consulted: October 20, 2026
- Cocinas tradicionales de Bali www.indonesia.travel/gb/en/destination/bali-nusa-tenggara/bali Ministry of Tourism, Republic of Indonesia Consulted: October 20, 2026