Oceania · Australasia
New Zealand
Māori knowledge, rēwena bread and seafood offer a route through territories and contemporary preparations in Aotearoa New Zealand.
Food and eating habits
How people eat in New Zealand
50 indicators exploring everyday meals, ingredients and food culture. Information is completed progressively from documented evidence.
47 of 50 indicators with documented information
Not all data are comparable: food supply, purchases and intake are different measures. Check the period, population and method for each finding. Qualitative descriptions do not establish percentages or amounts.
Timing and company
6/8
| Indicator | Findings and context |
|---|---|
| Meal times |
The main meal is in the evening and the midday meal is lighter. Scope, method and limitations
|
| Meals per day |
The three-main-meal pattern may include mid-morning and mid-afternoon snacks known as morning tea and afternoon tea. Scope, method and limitations
|
| Meal duration | Insufficient data in the sources consulted |
| Daily energy distribution | Insufficient data in the sources consulted |
| Weekdays and weekends |
Traditionally, the main Sunday meal could remain at midday, differing from the evening main-meal pattern. Scope, method and limitations
|
| Eating at home and away |
Main meals are associated with home; lunch during the school or working day may be eaten at school or work. Scope, method and limitations
|
| Cooking frequency |
The 2019 survey wave recorded an average of 6.5 lunches and dinners cooked at home per person per week. Scope, method and limitations
|
| Eating together |
Shared meals form part of family life and hospitality; dinners with relatives and friends and gatherings around food are documented cultural practices. Scope, method and limitations
|
Pantry and recipes
1/2
| Indicator | Findings and context |
|---|---|
| Most consumed ingredients |
On the recalled day, 73.9% of men reported consuming bread, 68.5% vegetables and 55.8% fruit. Scope, method and limitations
|
| Ingredient prevalence in recipes | Insufficient data in the sources consulted |
Cereals and plant foods
6/6
| Indicator | Findings and context |
|---|---|
| Cereals and cereal products |
On the recalled day, 18.5% of men reported pasta and pasta dishes, 20.7% rice and rice dishes, and 35.9% breakfast cereals. Scope, method and limitations
|
| Bread |
73.9% of men reported consuming bread on the recalled day. Scope, method and limitations
|
| Pulses |
15.6% of children ate legumes at least three times a week, as reported by their caregivers. Scope, method and limitations
|
| Vegetables |
68.5% of men reported consuming the vegetable group on the recalled day. Scope, method and limitations
|
| Fruit |
55.8% of men reported consuming fruit on the recalled day. Scope, method and limitations
|
| Potatoes, roots and tubers |
48.9% of men reported the mixed potato, kūmara, taro and related-dishes group on the recalled day. Scope, method and limitations
|
Protein foods
5/5
| Indicator | Findings and context |
|---|---|
| Meat |
On the recalled day, 24.7% of men reported poultry, 23.0% beef, 23.3% pork and 6.8% lamb and mutton. Scope, method and limitations
|
| Fish and seafood |
17.9% of men reported fish, seafood or dishes in this group on the recalled day. Scope, method and limitations
|
| Eggs |
22.3% of men reported eggs or preparations in the egg group on the recalled day. Scope, method and limitations
|
| Milk and dairy products |
On the recalled day, 26.7% of men reported cheese and 29.5% the other dairy-products group. Scope, method and limitations
|
| Protein sources |
At breakfast in the study sample, milk provided a mean 28.06% of protein, breakfast cereals 21.61% and bread 12.15%. Scope, method and limitations
|
Fats, flavours and condiments
3/3
| Indicator | Findings and context |
|---|---|
| Cooking fats |
On the recalled day, 18.0% of men reported butter or butter blends, 48.1% margarine or reduced-fat spreads and 7.9% the other fats-and-oils group. Scope, method and limitations
|
| Herbs and spices |
Described culinary uses: rosemary to flavour oil and vinegar; coriander in chutneys and curries; parsley in dressings, meat and fish dishes. Scope, method and limitations
|
| Sauces and condiments |
49.6% of men reported consuming the sauces, dressings and condiments group on the recalled day. Scope, method and limitations
|
Meal composition
6/6
| Indicator | Findings and context |
|---|---|
| Breakfast composition |
84.0% of children ate breakfast every day, according to their caregivers. Scope, method and limitations
|
| Main meal composition |
The traditional main meal centred on meat accompanied by vegetables. Scope, method and limitations
|
| Dinner composition |
In that historical tradition, roasts and stews featured at dinner. Scope, method and limitations
|
| Appetisers and snacks |
The estimated mean rate was 8.2 snacking episodes per 10 hours of recorded images. Scope, method and limitations
|
| Desserts and sweets |
On the recalled day, 6.7% of men reported the pudding/dessert group and 24.3% the cakes-and-baking group. Scope, method and limitations
|
| Portion sizes |
Between the surveys, mean biscuit portion per eating occasion increased by 5.3 g in men and 4.2 g in women. Scope, method and limitations
|
Techniques and equipment
5/5
| Indicator | Findings and context |
|---|---|
| Cooking techniques |
The traditional Māori hāngī cooks food with steam in an earth oven. Scope, method and limitations
|
| Vegetable preparation |
The described culinary repertoire includes grated raw carrot, celeriac and beetroot, and steamed vegetables. Scope, method and limitations
|
| Food preservation |
Traditional home preservation included fruit jams and vegetables in pickles and chutneys. Scope, method and limitations
|
| Fermented foods |
Mara kai is a Māori fermentation tradition also applied to corn after European arrival. Scope, method and limitations
|
| Kitchen equipment |
94% of households reported regular microwave use and 22% regular rice-cooker use. Scope, method and limitations
|
Drinks
3/3
| Indicator | Findings and context |
|---|---|
| Everyday drinks |
On the recalled day, 86.6% of men reported water; 84.9%, hot beverages; 15.0%, juice; and 37.1%, sweetened beverages. Scope, method and limitations
|
| Coffee and tea preparation |
The repertoire includes black tea and espresso coffee; flat white combines espresso with heated, frothed milk. Scope, method and limitations
|
| Drinks with meals |
The traditional light early-evening meal called tea included tea with food; this is a historical description of European-origin customs. Scope, method and limitations
|
Nutrition and dietary patterns
3/3
| Indicator | Findings and context |
|---|---|
| Energy and nutrients |
Median usual daily intakes for men and women, respectively: energy 10380 and 7448 kJ; protein 102 and 71 g; total fat 95 and 67 g; carbohydrate 278 and 207 g; fibre 22.1 and 17.5 g. Scope, method and limitations
|
| Salt and sugars |
Estimated median daily intake was 57.3 g of free sugars and 48.9 g of added sugars. Scope, method and limitations
|
| Dietary patterns |
Classification by complete food exclusion: 2.89% excluded red meat; 1.40% were pescatarian; 2.04%, vegetarian; and 0.74%, vegan. Scope, method and limitations
|
Shopping, prices and waste
7/7
| Indicator | Findings and context |
|---|---|
| Food expenditure |
Reported mean food spending: NZD 240 per household per week. Scope, method and limitations
|
| Cost of a common basket |
The reference family’s basic basket cost NZD 295 per week, averaged across surveyed supermarkets. Scope, method and limitations
|
| Cost of specific meals |
Fish and chips with Asian slaw was listed at NZD 33.00 on The Tomo Bar & Eatery menu in Waitomo. Scope, method and limitations
|
| Grocery shopping locations |
The major regulated operators accounted for 82% of grocery-market sales revenue. Scope, method and limitations
|
| Shopping frequency |
A regular main shop is distinguished from quick top-up trips for a few items. Scope, method and limitations
|
| Prepared food and delivery |
23% reported ordering takeaway food at least twice a week. Scope, method and limitations
|
| Household food waste |
Vegetables, bread and fruit stood out among foods reported wasted; spoilage before finishing them was a leading reason. Scope, method and limitations
|
Seasons and celebrations
2/2
| Indicator | Findings and context |
|---|---|
| Seasonal produce |
New Zealand asparagus is harvested from September to December; kiwifruit, from April to June. Scope, method and limitations
|
| Celebration food |
In 2026, the Matariki public holiday fell on 10 July. Sharing harvested foods such as kūmara is part of its celebrations. Scope, method and limitations
|
Explore its cuisinesRead as an article ↗
New Zealand: Rotorua, West Coast and Kaikōura
Documentary synthesis prepared with AI assistance. It does not replace specialist review or certify kitchen testing. · Updated 2 November 2026
Aotearoa and its relationship with food
New Zealand's cuisines bring together Māori knowledge, local produce and contemporary preparations made by its inhabitants. The current catalogue offers rēwena bread, whitebait fritters, chowder, kūmara soup and lolly cake. This selection of techniques and textures needs context; it does not fully define every table in the country.
Cultural and territorial sources offer ways to explore fermentation, cooking, gathering and sharing. The guide preserves the relationship between knowledge and community: a version published in the catalogue does not automatically represent all iwi or become a traditional Māori recipe because it uses a local ingredient.
Three regional routes
Rotorua: technique and hospitality
Hāngī experiences in Rotorua introduce cooking with heated stones in an earth oven alongside hosts and the context in which the food is shared. This is not equivalent to any slow roast, and the name cannot be transferred to a different cooking process without explanation. The current catalogue has no hāngī recipe: the guide includes it as a documented cultural reference.
West Coast: rivers, whitebait and communities
Whitebait has a documented place in West Coast life and the practices of Poutini Ngāi Tahu. This cultural relationship extends a view focused only on the ingredient on the plate. The catalogue's fritters offer a culinary starting point, but they are not labelled as a particular community's version. This guide does not reproduce fishing seasons or harvesting rules; these must always be checked in current sources.
Kaikōura: a kaimoana route
Lobster and other seafood preparations feature in Kaikōura's local food route. Produce, the coast and the work of food makers belong to the same territorial picture. The catalogue's chowder offers a different preparation through which to study fish and shellfish. It is not attributed to Kaikōura simply because it uses seafood: a regional version requires its own documentation.
Rēwena: looking at the ferment
A documented visual sequence shows the starter culture and dough work for rēwena bread. The ferment is not an inert ingredient: its condition influences preparation. The current recipe provides quantities and times for organising the process. Before starting, distinguish the starter's preliminary work from mixing, shaping and baking the bread.
Textures in the catalogue
A whitebait fritter, kūmara soup and chowder create different consistencies. Choosing one helps focus learning on an operation: distributing a mixture, transforming a root vegetable or coordinating pieces of fish with a base. The regional guide broadens questions about ingredients and communities; the individual recipe explains the version you can cook. Keeping both layers visible makes it possible to learn about the country without treating its knowledge and preparations as uniform.
Vocabulary for changing techniques
- Rēwena: bread with a documented starter culture and dough-making process.
- Hāngī: an earth-oven technique using heated stones, connected with its own knowledge and contexts.
- Kūmara: the name for sweet potato used in a soup in the catalogue.
- Whitebait: a reference to small fish that requires identifying the particular product and its context when reading a recipe.
Preliminary work is part of the bread
The documented sequence presents the rēwena starter and dough as related stages. A ferment has a condition and requires preliminary work; it is not an interchangeable label for any other bakery product. The recipe provides proportions for following this preparation. Comparing it with soup or a fritter helps distinguish transformative operations from simple final assembly.
From territory to people
Hāngī experiences in Rotorua, West Coast documentation of whitebait and Kaikōura's seafood routes reveal different knowledge and kinds of work. The sources invite questions about who cooks, obtains the food or explains a practice. The Māori dimension is not limited to a native ingredient: it includes relationships with communities, territory and transmission that must retain their context.
A route through consistencies
You can begin with rēwena bread, continue with kūmara soup and then explore the catalogue's whitebait fritters. The operations change between fermentation, transforming a root vegetable and distributing a mixture. Choose each session according to the technique you want to understand and compare its preliminary tasks. This route broadens home practice without presenting every slow cooking process as hāngī or assigning a recipe version to a specific community without evidence.
From territory to the current recipe collection
The linked rēwena bread and whitebait fritters offer ways to practise fermentation and cooking a mixture. The catalogue also offers soups and sweets. These recipes retain their association with New Zealand; the Rotorua, West Coast and Kaikōura routes provide context without attributing the versions to an undocumented locality or community.
Pantry and recipes
Most consumed ingredients. On the recalled day, 73.9% of men reported consuming bread, 68.5% vegetables and 55.8% fruit.
Observation period: 2008–2009. Men aged at least 19 in the New Zealand national nutrition survey. Fieldwork October 2008–October 2009; first single-day recall. National probability survey and multiple-pass 24-hour recall; weighted percentages adjusted using age- and sex-based models. Partial historical coverage: proportions reporting food groups, not kilograms per person per year or usual daily consumption. The vegetable group includes pulses and related dishes; not a ranking by weight.
Timing and company
Meal times. The main meal is in the evening and the midday meal is lighter.
Meals per day. The three-main-meal pattern may include mid-morning and mid-afternoon snacks known as morning tea and afternoon tea.
Weekdays and weekends. Traditionally, the main Sunday meal could remain at midday, differing from the evening main-meal pattern.
Eating at home and away. Main meals are associated with home; lunch during the school or working day may be eaten at school or work.
Eating together. Shared meals form part of family life and hospitality; dinners with relatives and friends and gatherings around food are documented cultural practices.
Cultural and historical description; no statistical survey period. Partial qualitative coverage; no population percentages, modal clock-time intervals, durations or habits of the entire current population.
Cooking frequency. The 2019 survey wave recorded an average of 6.5 lunches and dinners cooked at home per person per week.
Civilian noninstitutionalized resident population aged at least fifteen in New Zealand. 2019 survey wave; recall of the previous week. Probability survey; separate questions about personally cooking lunch and dinner at home in the previous week. Number of cooked meals, not distinct cooking days or preparation minutes. Historical survey wave; exact local fieldwork dates not verified.
Cereals and plant foods
Cereals and cereal products. On the recalled day, 18.5% of men reported pasta and pasta dishes, 20.7% rice and rice dishes, and 35.9% breakfast cereals.
Observation period: 2008–2009. Men aged at least 19 in the New Zealand national nutrition survey. Fieldwork October 2008–October 2009; first single-day recall. National probability survey and multiple-pass 24-hour recall; weighted percentages adjusted using age- and sex-based models. Partial historical coverage: proportions reporting groups on one day, not quantities or usual consumption. Groups include prepared dishes; dry or cooked weights are not measured and percentages cannot be added.
Bread. 73.9% of men reported consuming bread on the recalled day.
Observation period: 2008–2009. Men aged at least 19 in the New Zealand national nutrition survey. Fieldwork October 2008–October 2009; first single-day recall. National probability survey and multiple-pass 24-hour recall; weighted percentages adjusted using age- and sex-based models. Partial coverage: historical daily reporting prevalence, not grams per person or a breakdown by bread type or ingredients.
Pulses. 15.6% of children ate legumes at least three times a week, as reported by their caregivers.
Observation period: 2018/19–2019/20. New Zealand children aged 2–14; their main caregiver in the same household responded. Pooled 2018/19 and 2019/20 surveys; collection ended early in March 2020. Caregiver dietary-habits questionnaire, prevalence not age-adjusted; includes lentils, chickpeas, kidney beans, baked beans, hummus and legume soups. Partial historical coverage of reported child frequency; not dry/cooked grams, adult intake or direct observation. Pooled surveys are not directly comparable with separate annual results.
Vegetables. 68.5% of men reported consuming the vegetable group on the recalled day.
Observation period: 2008–2009. Men aged at least 19 in the New Zealand national nutrition survey. Fieldwork October 2008–October 2009; first single-day recall. National probability survey and multiple-pass 24-hour recall; weighted percentages adjusted using age- and sex-based models. Partial coverage: an aggregate group including pulses and vegetable dishes; individual vegetables, quantities and pulse intake cannot be separated.
Fruit. 55.8% of men reported consuming fruit on the recalled day.
Observation period: 2008–2009. Men aged at least 19 in the New Zealand national nutrition survey. Fieldwork October 2008–October 2009; first single-day recall. National probability survey and multiple-pass 24-hour recall; weighted percentages adjusted using age- and sex-based models. Partial coverage: fresh, canned, cooked or dried fruit as one group, without species breakdown or per-person quantities.
Potatoes, roots and tubers. 48.9% of men reported the mixed potato, kūmara, taro and related-dishes group on the recalled day.
Observation period: 2008–2009. Men aged at least 19 in the New Zealand national nutrition survey. Fieldwork October 2008–October 2009; first single-day recall. National probability survey and multiple-pass 24-hour recall; weighted percentages adjusted using age- and sex-based models. Partial coverage: prevalence for a mixed group, including fried preparations; not potato alone, intake weight or usual consumption.
Protein foods
Meat. On the recalled day, 24.7% of men reported poultry, 23.0% beef, 23.3% pork and 6.8% lamb and mutton.
Observation period: 2008–2009. Men aged at least 19 in the New Zealand national nutrition survey. Fieldwork October 2008–October 2009; first single-day recall. National probability survey and multiple-pass 24-hour recall; weighted percentages adjusted using age- and sex-based models. Partial historical coverage: proportions reporting consumption, not meat quantities or carcass/edible weights. Groups include processed meats and dishes; they can overlap and must not be added.
Fish and seafood. 17.9% of men reported fish, seafood or dishes in this group on the recalled day.
Observation period: 2008–2009. Men aged at least 19 in the New Zealand national nutrition survey. Fieldwork October 2008–October 2009; first single-day recall. National probability survey and multiple-pass 24-hour recall; weighted percentages adjusted using age- and sex-based models. Partial coverage: an aggregate group including fresh, frozen, smoked and canned fish, seafood and dishes. Species, quantities and fresh/preserved shares are not separated.
Eggs. 22.3% of men reported eggs or preparations in the egg group on the recalled day.
Observation period: 2008–2009. Men aged at least 19 in the New Zealand national nutrition survey. Fieldwork October 2008–October 2009; first single-day recall. National probability survey and multiple-pass 24-hour recall; weighted percentages adjusted using age- and sex-based models. Partial historical coverage: proportion reporting eggs and preparations within the group; not eggs per person, annual weight or all eggs incorporated into other foods.
Milk and dairy products. On the recalled day, 26.7% of men reported cheese and 29.5% the other dairy-products group.
Observation period: 2008–2009. Men aged at least 19 in the New Zealand national nutrition survey. Fieldwork October 2008–October 2009; first single-day recall. National probability survey and multiple-pass 24-hour recall; weighted percentages adjusted using age- and sex-based models. Partial coverage: other dairy groups cream, sour cream, yoghurt, dairy desserts, ice cream and dairy dips. These are not quantities or a combined share. Milk-group prevalence is omitted because it mixes animal milk and plant drinks.
Protein sources. At breakfast in the study sample, milk provided a mean 28.06% of protein, breakfast cereals 21.61% and bread 12.15%.
Subsample of 327 independently living participants aged 65–74 in Auckland. REACH dietary cohort from 2018–2019; diary analysis published in 2023, here limited to breakfast. Four consecutive-day food records including at least one weekend day, checked by a dietitian; food-group classification and mean percentage contribution to protein at that meal. Partial coverage of a local volunteer sample of older adults; not nationally representative or whole-day protein. Percentages refer to breakfast protein, not energy or consumers. Period is from the cohort description; figures are from diaries, not the frequency questionnaire.
Fats, flavours and condiments
Cooking fats. On the recalled day, 18.0% of men reported butter or butter blends, 48.1% margarine or reduced-fat spreads and 7.9% the other fats-and-oils group.
Observation period: 2008–2009. Men aged at least 19 in the New Zealand national nutrition survey. Fieldwork October 2008–October 2009; first single-day recall. National probability survey and multiple-pass 24-hour recall; weighted percentages adjusted using age- and sex-based models. Partial historical coverage: proportions reporting consumption, not fat grams, energy shares or usual cooking use. The fats-and-oils group mixes vegetable oils and animal fats and does not distinguish individual oils. Groups may overlap and must not be added.
Herbs and spices. Described culinary uses: rosemary to flavour oil and vinegar; coriander in chutneys and curries; parsley in dressings, meat and fish dishes.
Qualitative description without a statistical observation period. Partial qualitative coverage of herb uses; no recipe prevalence, consumption frequency, national ranking or spice quantities.
Sauces and condiments. 49.6% of men reported consuming the sauces, dressings and condiments group on the recalled day.
Observation period: 2008–2009. Men aged at least 19 in the New Zealand national nutrition survey. Fieldwork October 2008–October 2009; first single-day recall. National probability survey and multiple-pass 24-hour recall; weighted percentages adjusted using age- and sex-based models. Partial coverage: a broad group including gravy, tomato, cream, soy and cheese sauces, mayonnaise, oil-and-vinegar dressings, chutney and yeast extract. It does not measure individual condiment frequency or quantity or establish a popularity ranking.
Meal composition
Breakfast composition. 84.0% of children ate breakfast every day, according to their caregivers.
Observation period: 2018/19–2019/20. New Zealand children aged 2–14; their main caregiver in the same household responded. Pooled 2018/19 and 2019/20 surveys; collection ended early in March 2020. Caregiver questionnaire and prevalence not age-adjusted; daily-breakfast category. Partial coverage of reported child frequency; not breakfast foods, quantities or adult habits. Pooled surveys are not directly comparable with a single year.
Main meal composition. The traditional main meal centred on meat accompanied by vegetables.
Historical synthesis, particularly the nineteenth and early twentieth centuries. Partial qualitative coverage; not all present-day households, frequency, quantities, full menu structure or national preferences.
Dinner composition. In that historical tradition, roasts and stews featured at dinner.
British-origin culinary tradition in New Zealand. Historical synthesis, particularly the nineteenth and early twentieth centuries. Reading the historical context of meals and their preparations. Partial qualitative coverage; not all present-day households, frequency, quantities, full menu structure or national preferences.
Appetisers and snacks. The estimated mean rate was 8.2 snacking episodes per 10 hours of recorded images.
Subsample of 158 schoolchildren in the Wellington region. Kids’Cam images from 2014/15, analysed for available Thursday and Saturday recordings; distinct from the later coding year. Coding episodes outside main meals, excluding water; negative-binomial regression with sampling weights and recorded-time denominator. Local partial coverage: not a national rate or a fully observed day. Time-based definitions and camera removal affect counts; no grams or energy measured.
Desserts and sweets. On the recalled day, 6.7% of men reported the pudding/dessert group and 24.3% the cakes-and-baking group.
Observation period: 2008–2009. Men aged at least 19 in the New Zealand national nutrition survey. Fieldwork October 2008–October 2009; first single-day recall. National probability survey and multiple-pass 24-hour recall; weighted percentages adjusted using age- and sex-based models. Partial food-group coverage: not evidence of eating them at the end of a meal. Desserts includes milk puddings, cheesecake, crumbles, mousse, steamed sponges, sweet pies, pavlova and meringues; no portions or grams measured.
Portion sizes. Between the surveys, mean biscuit portion per eating occasion increased by 5.3 g in men and 4.2 g in women.
Observation period: 1997–2008/2009. Adults in New Zealand national nutrition surveys, compared by sex. Historical comparison of 1997 with 2008/2009; scientific abstract published in 2014. Multiple-pass single-day recall and linear regression comparing mean portion size per eating occasion. Partial coverage of a change in biscuit grams, not absolute portion size or a current recommendation. Source is a conference abstract; original portions of all foods cannot be reconstructed.
Techniques and equipment
Cooking techniques. The traditional Māori hāngī cooks food with steam in an earth oven.
Food preservation. Traditional home preservation included fruit jams and vegetables in pickles and chutneys.
Fermented foods. Mara kai is a Māori fermentation tradition also applied to corn after European arrival.
Historical description of traditional practices; not a measurement of current use. Partial qualitative coverage; no frequency, national percentages or household distribution. This description is not a validated preparation or preservation procedure.
Vegetable preparation. The described culinary repertoire includes grated raw carrot, celeriac and beetroot, and steamed vegetables.
New Zealand horticultural culinary guide; no consumer sample. Practical guide without a statistical observation period. Reading a New Zealand cultural description or culinary guide, distinguished from a behaviour survey. Partial qualitative coverage; no frequency, national percentages or household distribution. This description is not a validated preparation or preservation procedure.
Kitchen equipment. 94% of households reported regular microwave use and 22% regular rice-cooker use.
Observation period: 2015–2016. Survey of 560 owner-occupied and rented New Zealand houses, post-weighted by housing tenure. Fieldwork September 2015–June 2016; report published in 2018. Self-completed household appliance-use questionnaire; weighted percentages from the chart’s overall series. Partial historical coverage of reported use, not ownership of each appliance or time used. Owned/rented refers to housing. Subject to sampling error; not current rates or coverage of all kitchen equipment.
Drinks
Everyday drinks. On the recalled day, 86.6% of men reported water; 84.9%, hot beverages; 15.0%, juice; and 37.1%, sweetened beverages.
Observation period: 2008–2009. Men aged at least 19 in the New Zealand national nutrition survey. Fieldwork October 2008–October 2009; first single-day recall. National probability survey and multiple-pass 24-hour recall; weighted percentages adjusted using age- and sex-based models. Partial coverage of men and one day only: not volumes, usual frequency or meal-linked drinks. Hot beverages combines teas, coffee and substitutes, and hot chocolate; these cannot be separated. Categories overlap.
Coffee and tea preparation. The repertoire includes black tea and espresso coffee; flat white combines espresso with heated, frothed milk.
Cultural description without a statistical observation period. Partial qualitative coverage; no cups, volumes, frequency, national shares or current habits of all households.
Drinks with meals. The traditional light early-evening meal called tea included tea with food; this is a historical description of European-origin customs.
History of meal timing and accompaniment; not a contemporary national measurement. Partial qualitative coverage; no cups, volumes, frequency, national shares or current habits of all households.
Nutrition and dietary patterns
Energy and nutrients. Median usual daily intakes for men and women, respectively: energy 10380 and 7448 kJ; protein 102 and 71 g; total fat 95 and 67 g; carbohydrate 278 and 207 g; fibre 22.1 and 17.5 g.
Observation period: 2008/09. New Zealand residents aged at least 15; national survey with 4721 participants. Fieldwork October 2008–October 2009; sex-specific results. 24-hour recalls; repeat recalls in a subsample and PC-SIDE adjustment for within-person variation to estimate usual intake distributions. Historical self-reported estimates subject to under-reporting and food-composition errors. Separate medians, not a combined diet or recommendations. Excludes supplements except those supplying energy.
Salt and sugars. Estimated median daily intake was 57.3 g of free sugars and 48.9 g of added sugars.
New Zealand residents aged at least 15; national survey with 4721 participants. Survey from 2008–2009; later published reanalysis without new observations. 24-hour recalls and repeats; FOODfiles sugar estimates, survey-design weighting and MSM adjustment for within-person variation. Partial coverage: sodium and salt are not documented. Free sugars includes honey, syrups and juice sugars; added sugars uses a different definition. These are not total sugars and must not be summed. Composition estimates, not direct chemical assays.
Dietary patterns. Classification by complete food exclusion: 2.89% excluded red meat; 1.40% were pescatarian; 2.04%, vegetarian; and 0.74%, vegan.
Observation period: 2018/19–2019/20. New Zealand residents aged at least 15; 23292 responses to the exclusion question. Waves 2018/19 and 2019/20, from July 2018; collection suspended on 19 March 2020. Multistage stratified probability survey and weighted prevalence; prioritised mutually exclusive categories based on foods respondents report never eating, including in prepared dishes. Partial coverage: flexitarianism not measured. Pescatarian excludes red meat and poultry; vegetarian also excludes fish and seafood; vegan additionally excludes eggs and dairy. Separate categories, not cumulative shares or self-identification; reporting error is possible.
Shopping, prices and waste
Food expenditure. Reported mean food spending: NZD 240 per household per week.
Households described by 1501 people interviewed in New Zealand. Interviews 14–28 July 2025. Kantar survey; participant reports and a sample described as nationally representative. Partial: not monthly per-person expenditure or a budget share. Includes food from different channels, including eating out; no monthly conversion and not a minimum basket.
Cost of a common basket. The reference family’s basic basket cost NZD 295 per week, averaged across surveyed supermarkets.
Model family: two adults and children aged 10 and 4; 16 supermarkets in Auckland, Wellington, Christchurch and Dunedin. Shelf prices 13–23 February 2025; later publication. Fixed age- and sex-specific quantities from the allocation table; lowest regular shelf prices and weighted category costs. Modelled basket, not observed spending or individual advice. Excludes eating out, travel and some condiments; assumes cooking facilities and supermarket access. Four-city coverage, no rural extrapolation.
Cost of specific meals. Fish and chips with Asian slaw was listed at NZD 33.00 on The Tomo Bar & Eatery menu in Waitomo.
One establishment and one main dish in Waitomo, New Zealand. Menu identified by the establishment as 2025; not a current national price. Reading the original menu linked from the supplier’s website. Local advertised-price example, not a transaction or mean. Portion weight unspecified; no comparison with home cooking or differently sized dishes.
Grocery shopping locations. The major regulated operators accounted for 82% of grocery-market sales revenue.
New Zealand retail grocery market. Sales revenue for 2024. Analysis of operator sales revenue and retail trade data; not a consumer preference survey. Partial: groceries includes food and non-food products. Not a share of all food expenditure; no separate market, shop and online shares, and not a proportion of people.
Shopping frequency. A regular main shop is distinguished from quick top-up trips for a few items.
Description of shopping modes in the report for 2024, published later. Partial qualitative coverage: no weekly visit counts or spend per trip. Indirectly cited survey figures not published without verifying originals.
Prepared food and delivery. 23% reported ordering takeaway food at least twice a week.
Households described by 1501 people interviewed in New Zealand. Interviews 14–28 July 2025. Kantar survey; participant reports and a sample described as nationally representative. Partial: reported frequency without expenditure or specific dishes. Not equivalent to home delivery or supermarket ready meals; recall bias possible.
Household food waste. Vegetables, bread and fruit stood out among foods reported wasted; spoilage before finishing them was a leading reason.
Interviews 14–28 July 2025. Partial qualitative household self-report coverage: no kg per person per year or bin audit. No conversion from expenditure shares to mass and no measurable edible/inedible boundary.
Seasons and celebrations
Seasonal produce. New Zealand asparagus is harvested from September to December; kiwifruit, from April to June.
General local harvest calendars for two crops; no statistical crop year. Partial: not a complete regional or cultivar calendar. Harvest is not retail availability; storage and northern-hemisphere supply can extend kiwifruit availability. Not evidence of imported-product seasons.
Celebration food. In 2026, the Matariki public holiday fell on 10 July. Sharing harvested foods such as kūmara is part of its celebrations.
Official holiday date for 2026 and cultural description of shared foods. Partial, not a catalogue of all celebrations or dishes. The date changes annually with the maramataka and must not be treated as fixed. Iwi and communities celebrate differently; some observe Puanga. No participation estimate or single prescribed menu.
Places and communities
One country, many cuisines
An initial selection of regions to explore. Culinary boundaries may differ from administrative divisions.
Rotorua
Costa Oeste de la Isla Sur
Cook
Recipes connected with New Zealand
Each recipe documents one version. Geographic associations do not imply an exclusive origin.
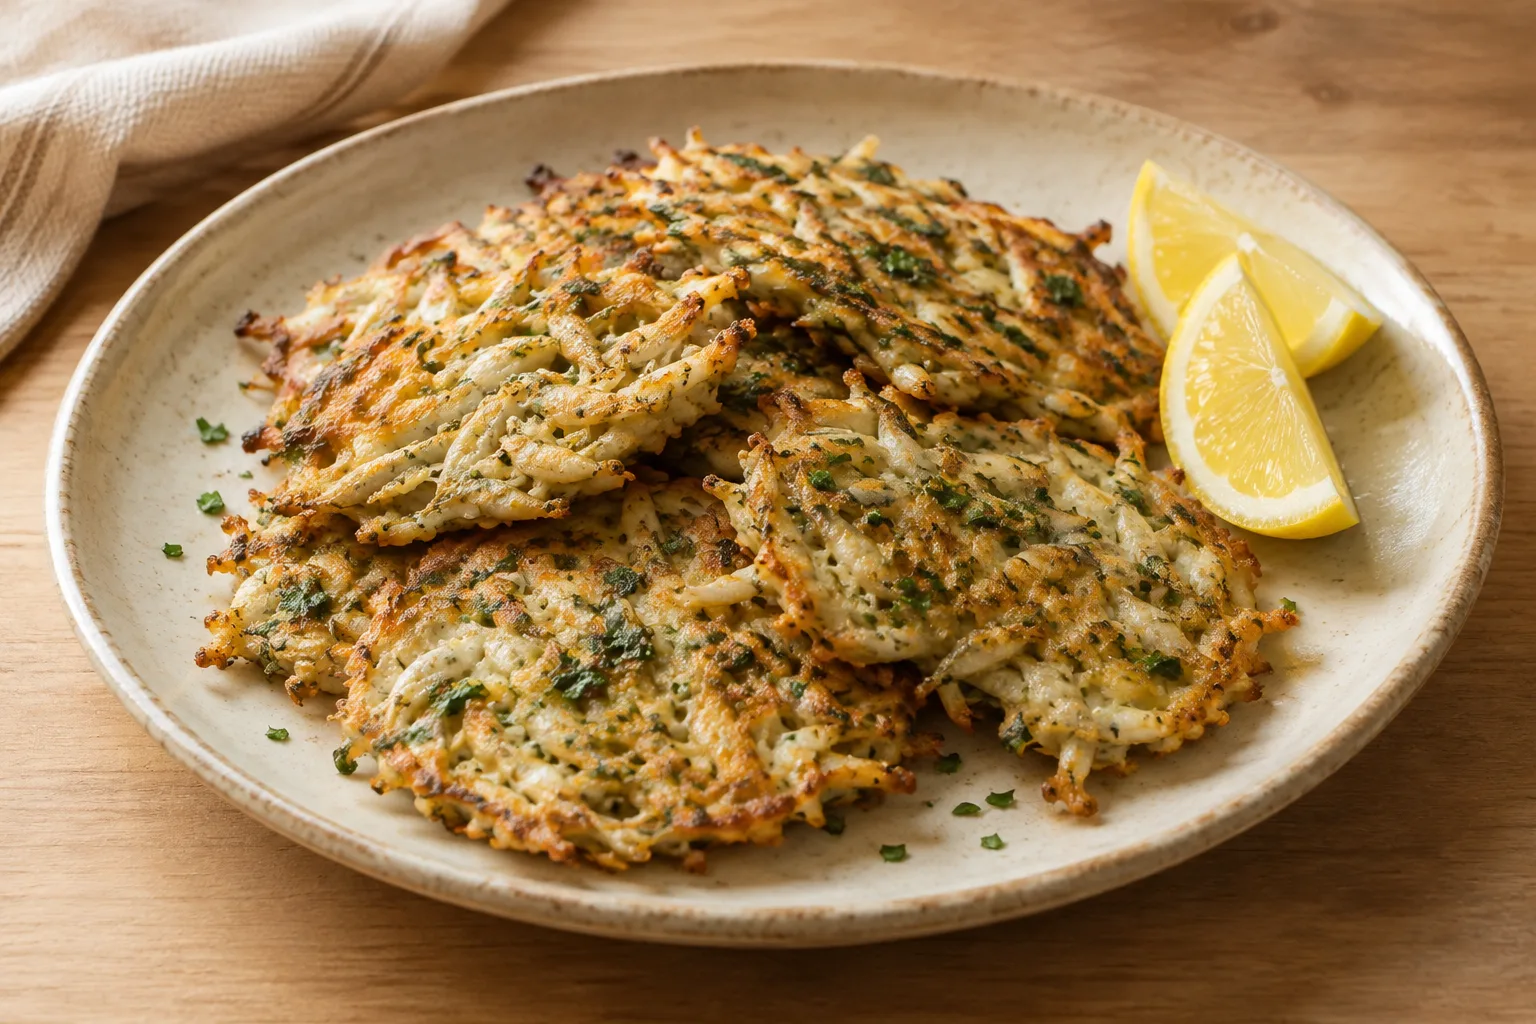
Whitebait fritters with flour and parsley
Light whitebait fritters with egg, a little flour and parsley, pan-fried until golden and served with lemon.
View recipe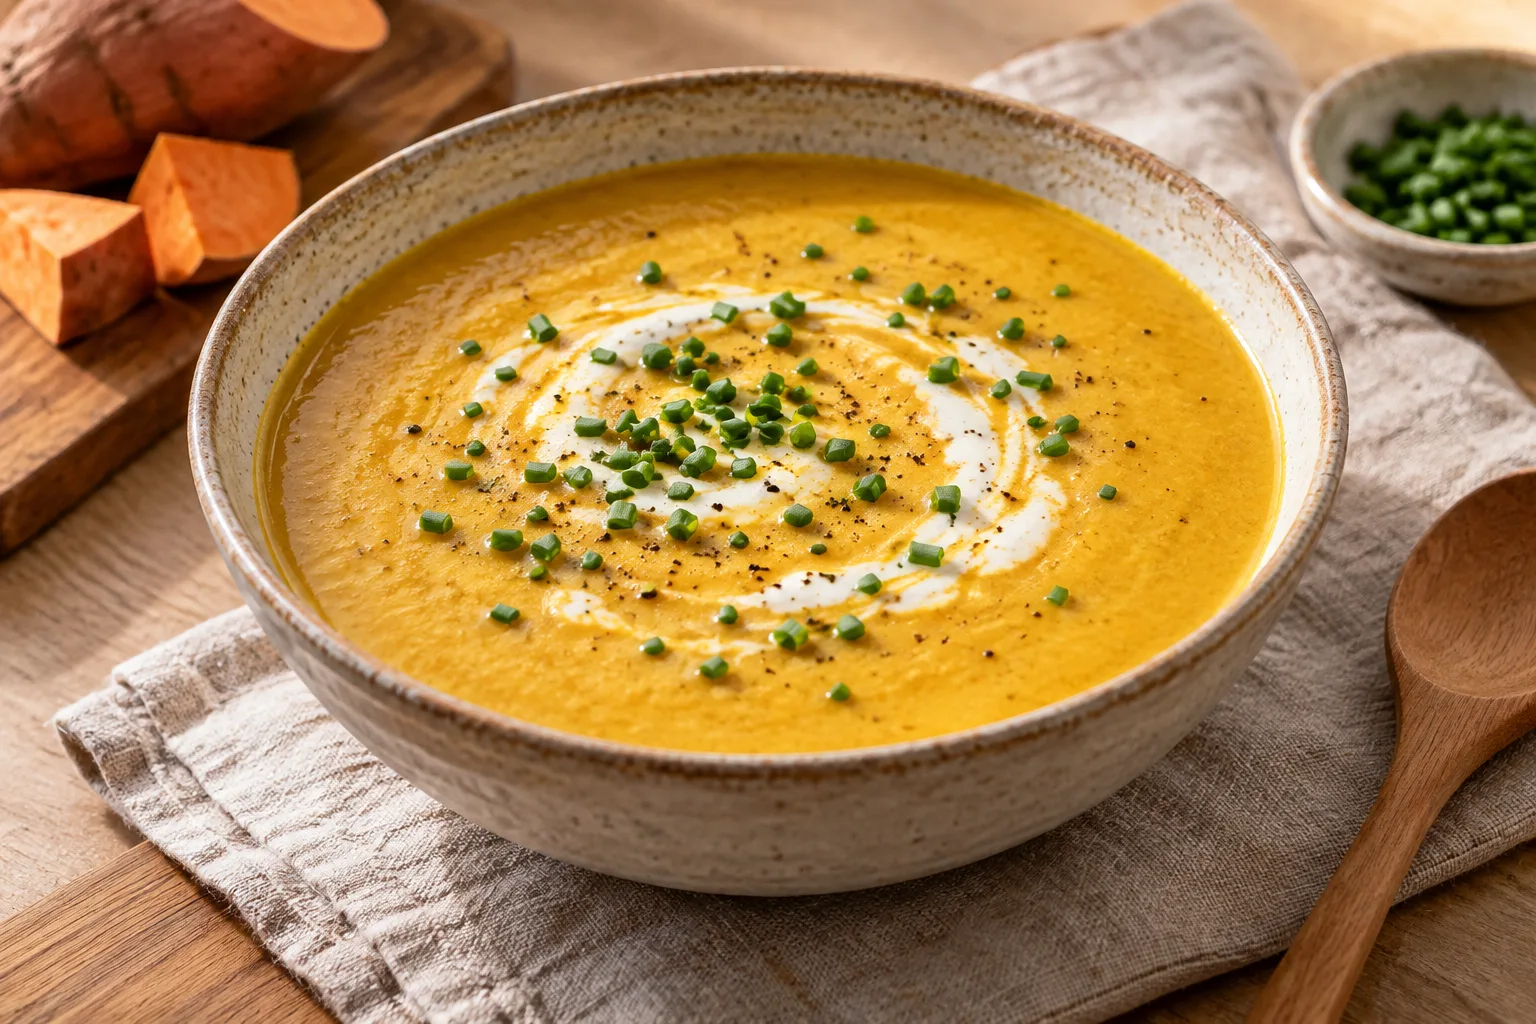
New Zealand Curried Kumara Soup
A mild, creamy vegetarian kumara soup, scented with curry and finished with coconut milk, yogurt, and chives.
View recipe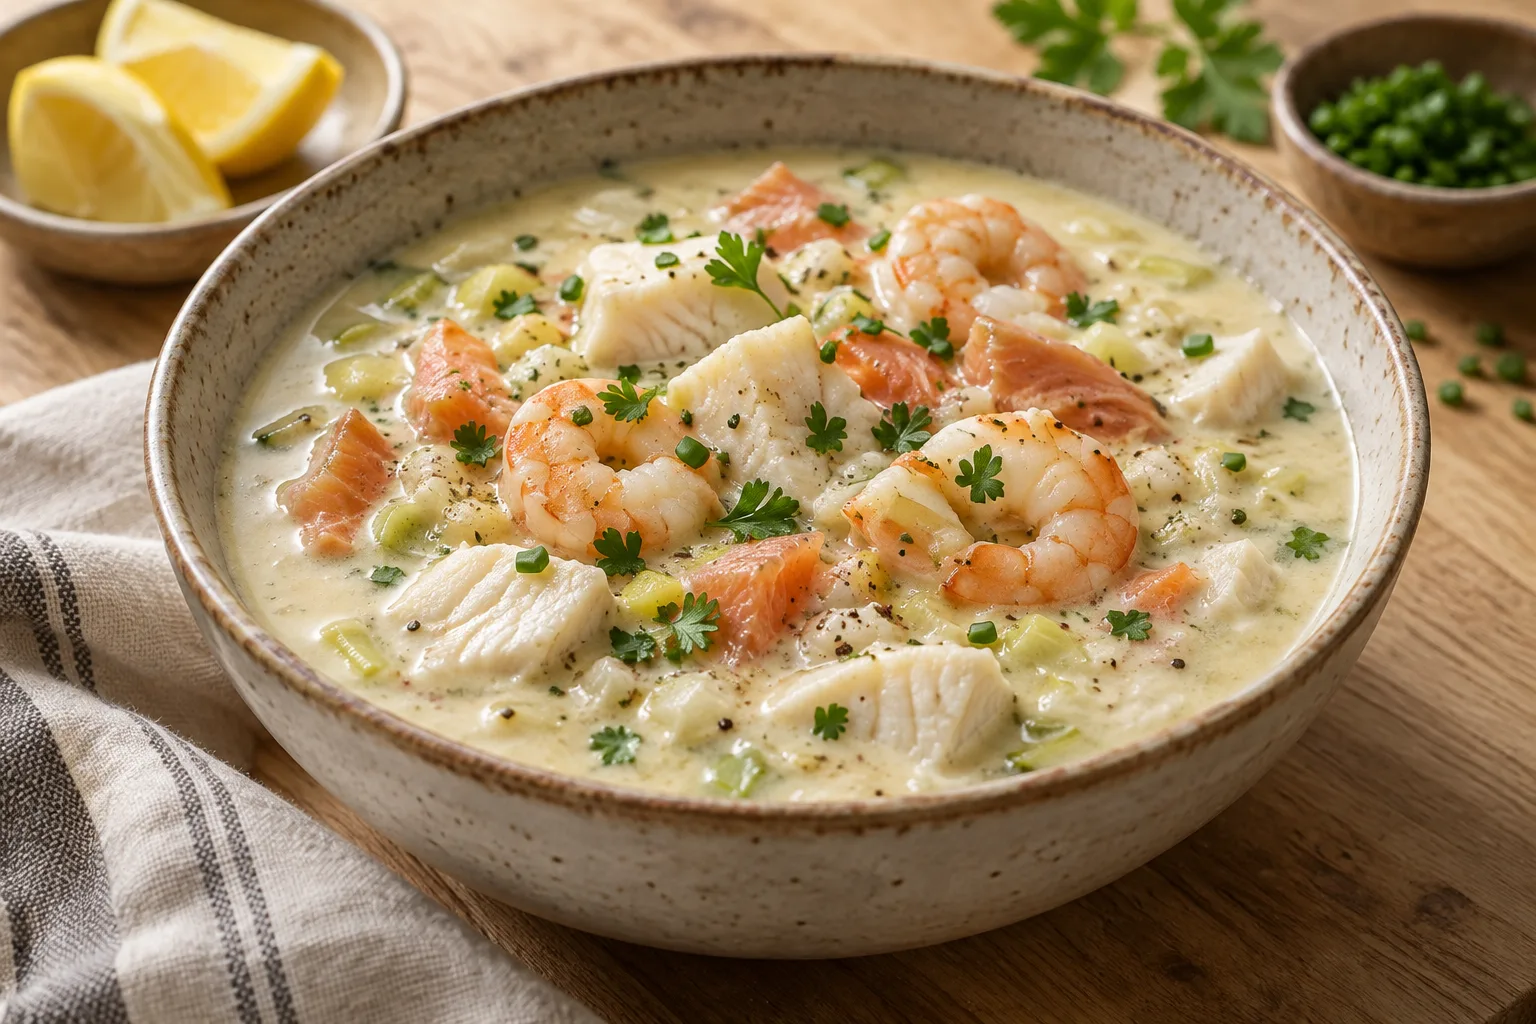
New Zealand Fish and Seafood Chowder
A creamy soup for 4, with fish, prawns, smoked fish, and a base thickened with flour, milk, stock, and cream.
View recipe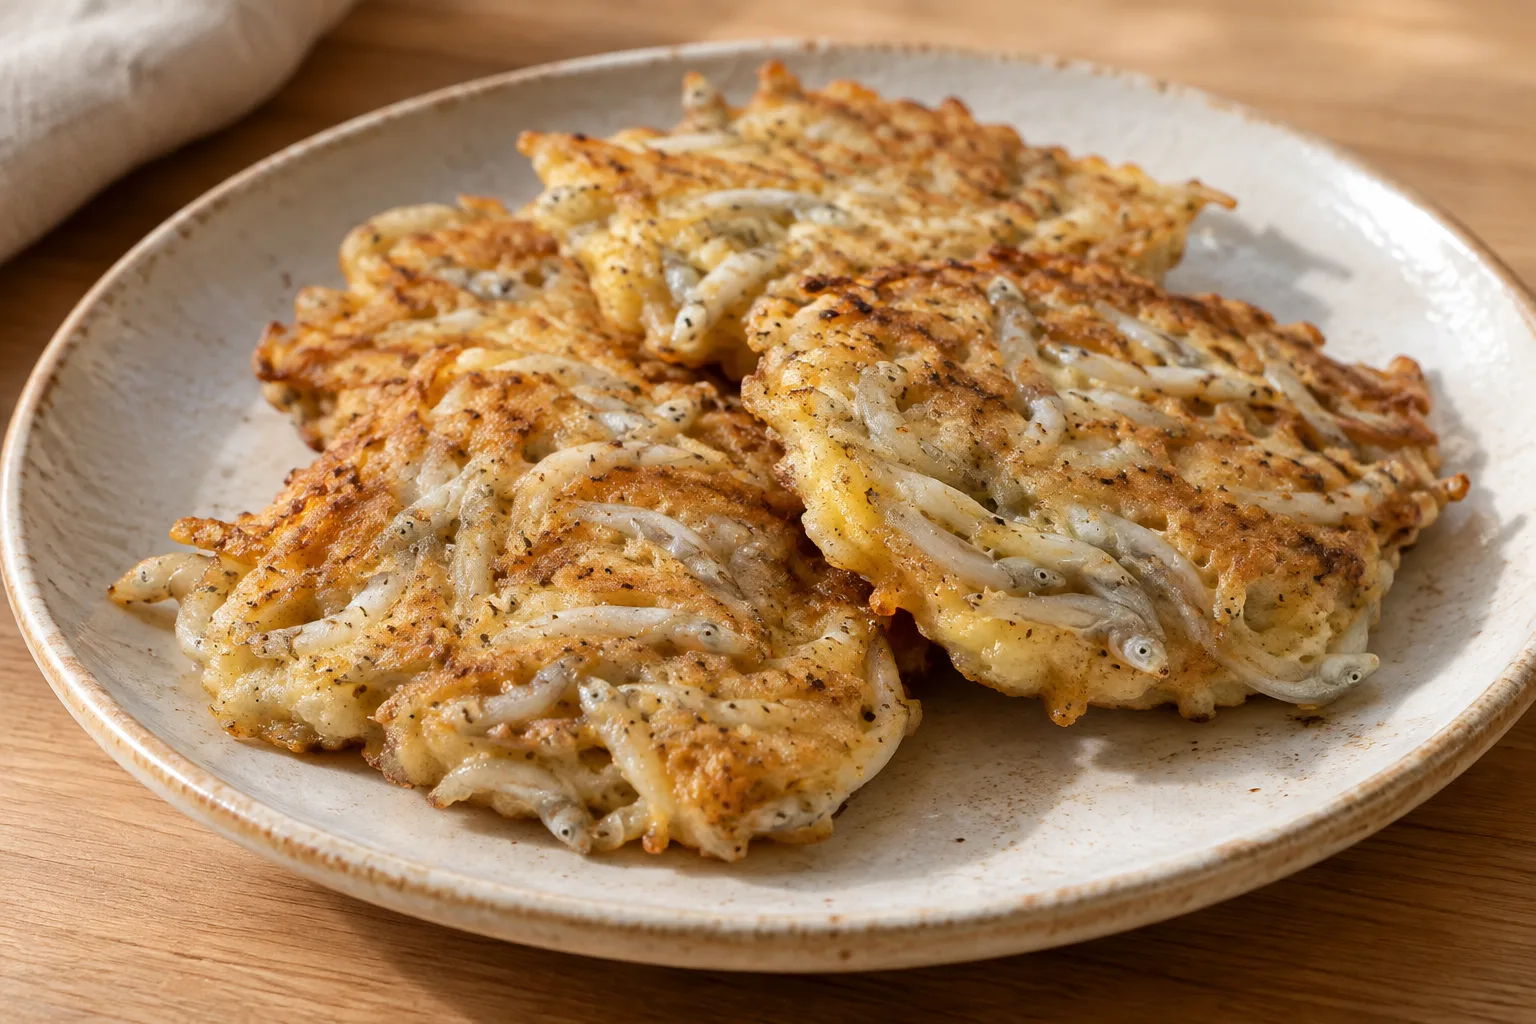
Flourless whitebait and egg fritters
Simple whitebait and egg fritters, fried in batches until golden. The fish-to-egg balance and brief cooking keep the fish in the foreground.
View recipe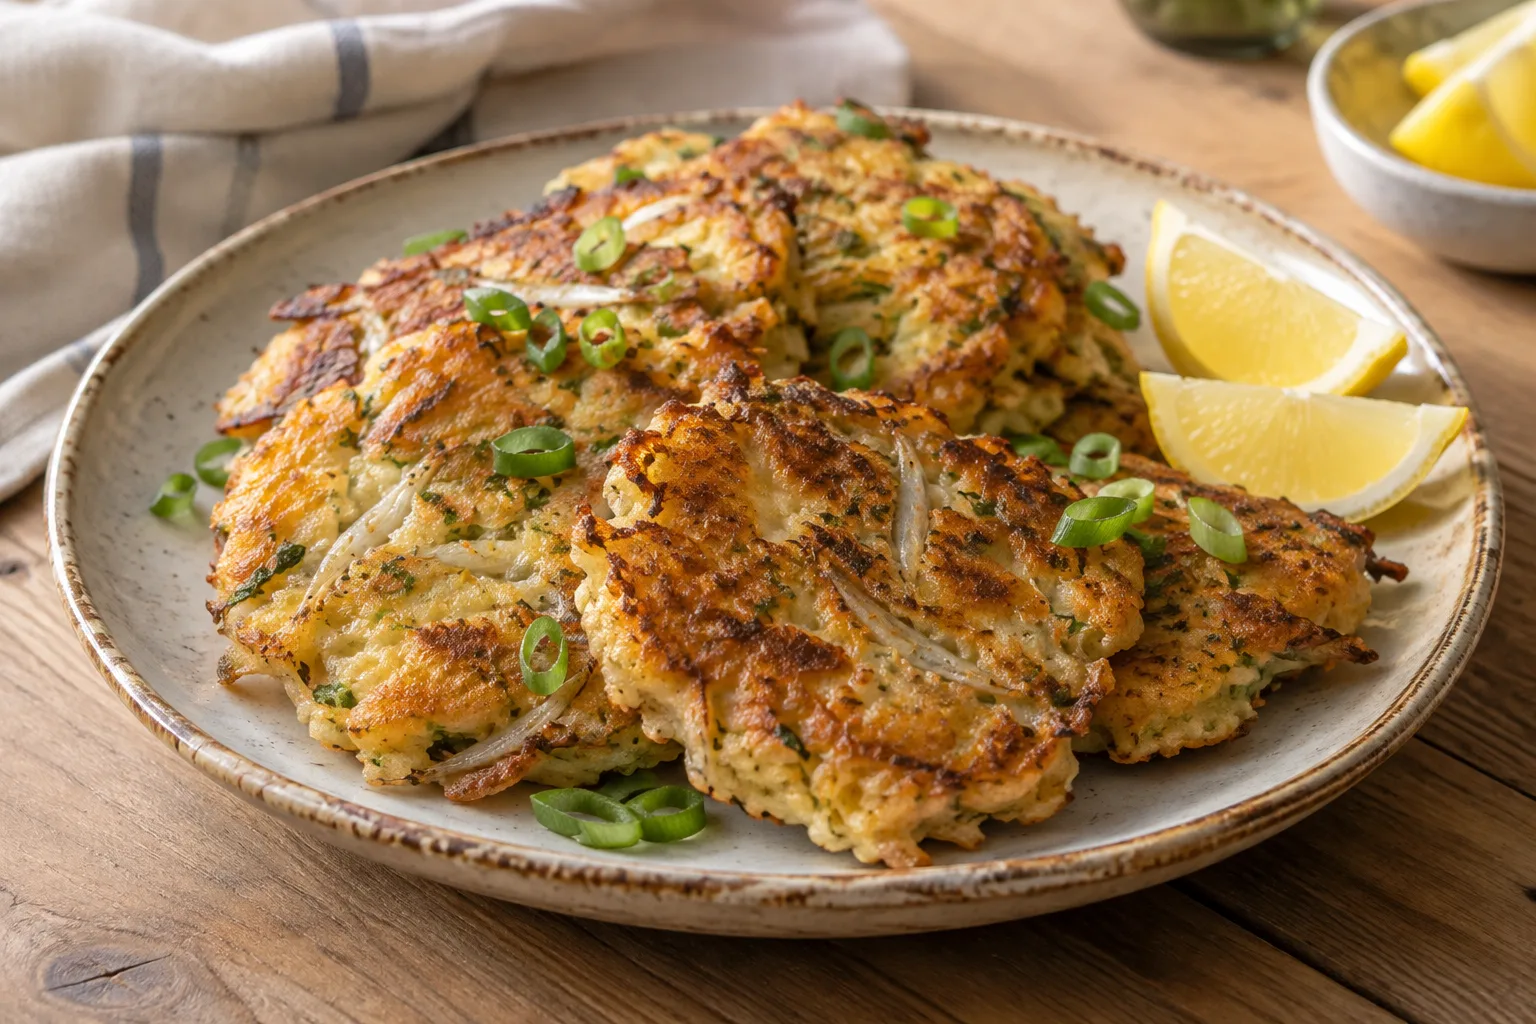
Whitebait fritters with potato and spring onion
Whitebait fritters with egg, potato and scallions, fried until golden. Makes 6 servings.
View recipe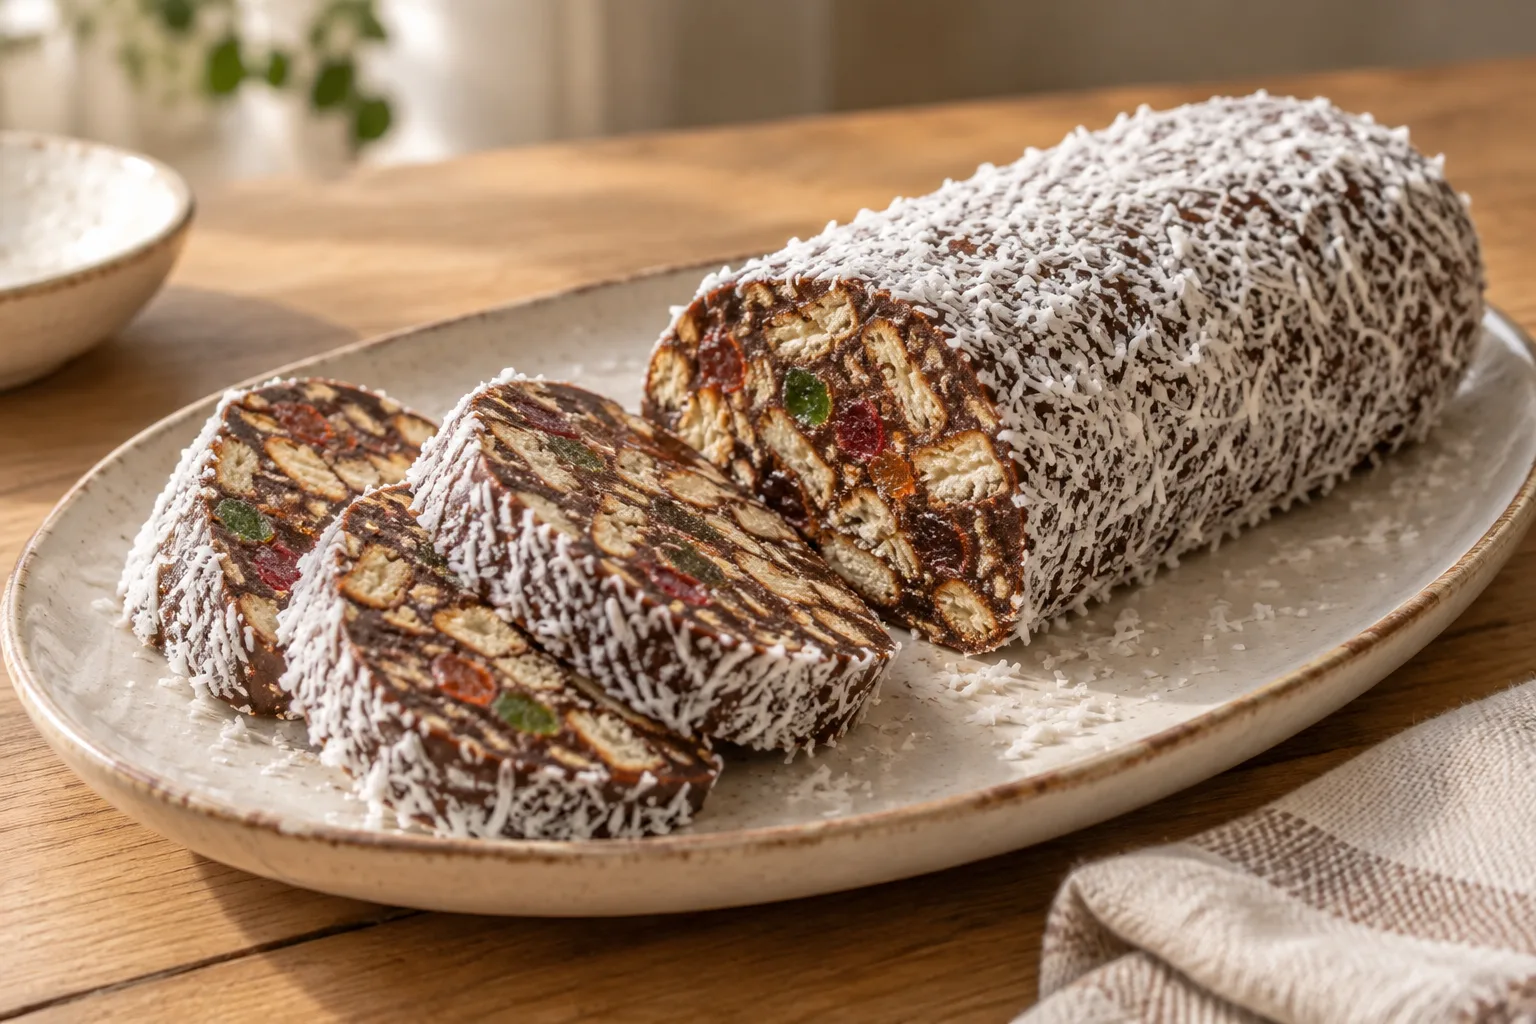
New Zealand Lolly Cake
A no-bake New Zealand sweet made with malt biscuits, butter, sweetened condensed milk and fruit sweets, shaped into a log and coated with coconut.
View recipe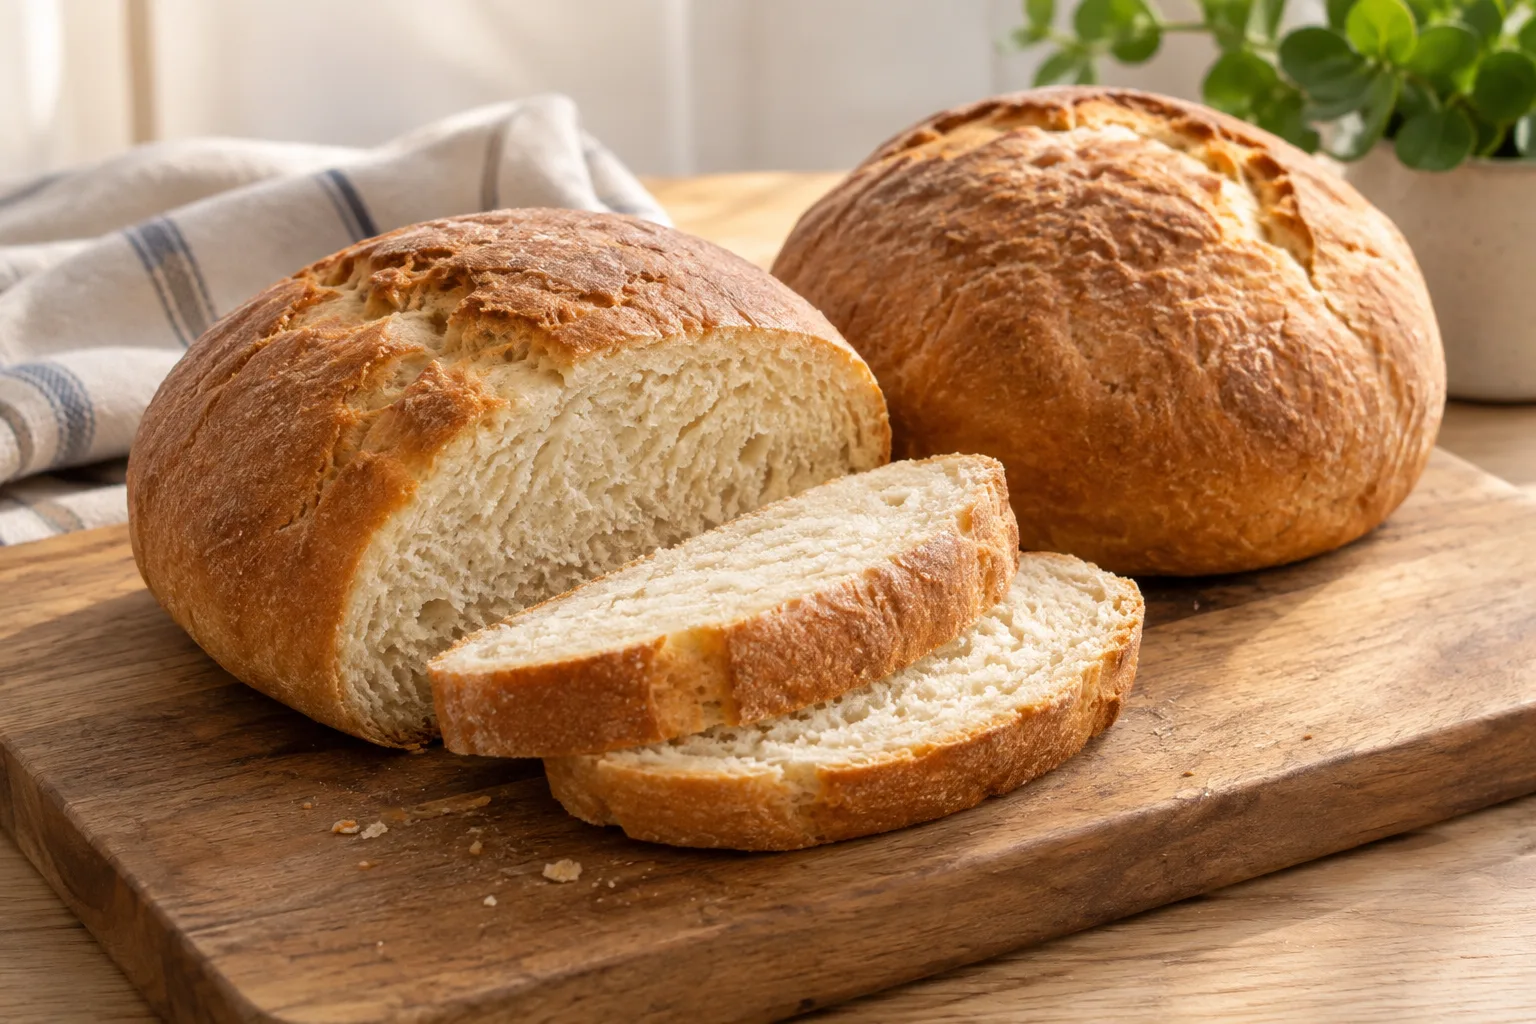
Rēwena bread (parāoa rēwena)
A Māori bread from New Zealand made with a fermented potato, flour, and sugar starter. This recipe makes two small loaves and takes several days for the starter to become bubbly.
View recipe
Sources consulted
Read the sources and each document’s scope. A heritage inscription concerns a particular practice, not all of a country’s cuisine.
- Secular changes in intakes of foods among New Zealand adults from 1997 to 2008/09 pmc.ncbi.nlm.nih.gov/articles/PMC10271404/ Public Health Nutrition / author full text archived by PubMed Central Consulted: October 31, 2026
- Eating teara.govt.nz/en/eating/print Te Ara — Encyclopedia of New Zealand Consulted: October 31, 2026
- A global analysis of cooking around the world: Year 2 www.gallup.com/file/analytics/513242/Gallup-Cookpad-Global%20Analysis%20Report-Year%202.pdf Gallup and Cookpad Consulted: October 31, 2026
- Children’s Dietary Habits — Findings from the 2018/19 and 2019/20 New Zealand Health Survey ndhadeliver.natlib.govt.nz/delivery/DeliveryManagerServlet?dps_pid=IE84343066 New Zealand Ministry of Health; original PDF archived by the National Library of New Zealand Consulted: October 31, 2026
- Dietary Patterns, Their Nutrients, and Associations with Socio-Demographic and Lifestyle Factors in Older New Zealand Adults pmc.ncbi.nlm.nih.gov/articles/PMC7695209/ Nutrients / original REACH cohort analysis Consulted: October 31, 2026
- Protein intake, distribution, and sources in community-dwelling older adults living in Auckland, New Zealand mro.massey.ac.nz/server/api/core/bitstreams/da046ede-d471-4df2-8306-bac7cc0f17fb/content Nutrition and Healthy Aging / original article in Massey University repository Consulted: October 31, 2026
- Fresh herbs, flowers — Tāima, Pāhiri www.vegetables.co.nz/vegetable-a-z/vegetables-a-z/fresh-herbs-flowers-e-g-taima-pahiri-pahir… Vegetables.co.nz Consulted: October 31, 2026
- Food teara.govt.nz/en/food/print Te Ara — Encyclopedia of New Zealand Consulted: October 31, 2026
- The Frequency and Context of Snacking among Children: An Objective Analysis Using Wearable Cameras pmc.ncbi.nlm.nih.gov/articles/PMC7824478/ Nutrients / original Kids’Cam analysis Consulted: October 31, 2026
- Changes in Portion Sizes of Snack Foods Consumed by New Zealand Adults — conference abstract assets.nutritionsociety.ac.nz/Downloads/ProceedingsNSNZ_2014Vol38.pdf Nutrition Society of New Zealand / Nutrients2014,6,4731–4749 Consulted: October 31, 2026
- Māori foods — Traditional cooking and preserving teara.govt.nz/en/maori-foods-kai-maori/page-2 Te Ara — Encyclopedia of New Zealand Consulted: October 31, 2026
- Cooking vegetables www.vegetables.co.nz/in-the-kitchen/tips-and-advice/cooking-methods Vegetables.co.nz Consulted: October 31, 2026
- Cooking — Cooking methods teara.govt.nz/en/cooking/page-2 Te Ara — Encyclopedia of New Zealand Consulted: October 31, 2026
- House Condition Survey 2015/16: Analysis of energy efficiency data d39d3mj7qio96p.cloudfront.net/media/documents/BRANZ-House-Condition-Survey-2015-2016-Energy-… BRANZ; report prepared for the Energy Efficiency and Conservation Authority Consulted: October 31, 2026
- Tea, coffee and soft drinks — Tea and coffee teara.govt.nz/en/tea-coffee-and-soft-drinks/page-1 Te Ara — Encyclopedia of New Zealand Consulted: October 31, 2026
- A Focus on Nutrition — Chapter 3: Energy and macronutrients www.health.govt.nz/system/files/2011-10/a-focus-on-nutrition-ch3_0.pdf New Zealand Ministry of Health and University of Otago Consulted: October 31, 2026
- Estimating Free and Added Sugar Intakes in New Zealand pmc.ncbi.nlm.nih.gov/articles/PMC5748743/ Original peer-reviewed research archived by PubMed Central Consulted: October 31, 2026
- The prevalence of vegetarians, vegans and other dietary patterns that exclude some animal-source foods in a representative sample of New Zealand adults pmc.ncbi.nlm.nih.gov/articles/PMC10830381/ Original peer-reviewed research archived by PubMed Central Consulted: October 31, 2026
- 2025 Food Waste Survey — Food shopping and consumption behaviours www.rabobank.co.nz/media-releases/2025/07102025-how-tighter-household-budgets-are-changing-k… Rabobank and KiwiHarvest; Kantar research Consulted: November 1, 2026
- Information Package for Users of the New Zealand Estimated Food Costs 2025 ourarchive.otago.ac.nz/view/pdfCoverPage?download=true&filePid=13458491050001891&instCode=64… Department of Human Nutrition, University of Otago Consulted: November 1, 2026
- The Tomo Bar & Eatery — Food menu www.thetomobar.co.nz/the-food/ The Tomo Bar & Eatery, Waitomo Consulted: November 1, 2026
- 2025 MENU — The Tomo Bar & Eatery, Waitomo www.thetomobar.co.nz/site_files/31989/upload_files/2025MENU.pdf?dl=1 The Tomo Bar & Eatery Consulted: November 1, 2026
- 2024 Annual Grocery Report www.comcom.govt.nz/__data/assets/pdf_file/0028/368047/Annual-Grocery-Report-2024-6-August-20… New Zealand Commerce Commission Consulted: November 1, 2026
- 2025 Food Waste Survey — Household food waste www.rabobank.co.nz/media-releases/2025/0808925-less-food-being-thrown-away-as-kiwis-show-gre… Rabobank and KiwiHarvest; Kantar research Consulted: November 1, 2026
- Asparagus — Grown in NZ www.vegetables.co.nz/asparagus-queen/grown-in-nz Vegetables New Zealand Consulted: November 1, 2026
- Commercial kiwifruit growing NZ: statistics and guidance www.tupu.nz/en/fact-sheets/kiwifruit Tupu.nz — Te Puni Kōkiri Consulted: November 1, 2026
- Matariki — Frequently asked questions www.matariki.com/faqs Mānawatia a Matariki; official government-supported programme Consulted: November 1, 2026
- Matariki Ahunga Nui — Matariki as a time of celebration www.tepapa.govt.nz/learn/for-educators/teaching-resources/matariki-for-teachers/celebrate/te… Museum of New Zealand Te Papa Tongarewa Consulted: November 1, 2026
- Elaboración del pan rēwena teara.govt.nz/en/interactive/40265/making-rewena-bread Te Ara — Encyclopedia of New Zealand Consulted: October 20, 2026
- Comida y bebida de Nueva Zelanda traveltrade.newzealand.com/new-zealand-food-and-drink/ Tourism New Zealand Consulted: October 20, 2026
- Whitebait y tradición de Costa Oeste www.wcrc.govt.nz/environment/water/whitebaiting West Coast Regional Council Consulted: October 20, 2026
- Kaikoura Seafood | Seafood In Kaikoura | Seafood Kaikoura | Kaikōura www.kaikoura.co.nz/stories/where-to-get-the-best-seafood Destination Kaikōura Consulted: November 1, 2026