Asia · Eastern Asia

Japan

Recipes connected with Japan

Food and eating habits

How people eat in Japan

50 indicators exploring everyday meals, ingredients and food culture. Information is completed progressively from documented evidence.

50 of 50 indicators with documented information

Not all data are comparable: food supply, purchases and intake are different measures. Check the period, population and method for each finding. Qualitative descriptions do not establish percentages or amounts.

Timing and company

8/8
Timing and company — Japan
IndicatorFindings and context
Meal times
Quantitative findingSurvey

Mean start±standard deviation, h:min: breakfast 7:24±0:53, lunch 12:32±0:32 and dinner 19:19±0:55.

Scope, method and limitations
Observation period
2016–2018
Unit
h:min, mean±SD
Population or sample
2681 adults aged 20–79, private-household volunteers; adult MINNADE component.
Geographic scope
32 prefectures; historical 2016–2018 data, not nationally representative.
Definition and method
Eight weighed dietary-record days, two nonconsecutive days per season; self-reported start and finish times.
Comparison limitations
Partial sample coverage. Self-identified breakfast, lunch, dinner and snacks; water-only occasions excluded. These are not current whole-population means. Consumption days only; n=2655 breakfast, 2676 lunch and 2679 dinner. These are not modal intervals or percentiles.
Meals per day
Quantitative findingSurvey

Means±standard deviation: 2·92±0·21 main meals, 1·74±1·24 snacks and 4·66±1·27 eating occasions per day.

Scope, method and limitations
Observation period
2016–2018
Unit
occasions/day, mean±SD
Population or sample
2681 adults aged 20–79, private-household volunteers; adult MINNADE component.
Geographic scope
32 prefectures; historical 2016–2018 data, not nationally representative.
Definition and method
Eight weighed dietary-record days, two nonconsecutive days per season; self-reported start and finish times.
Comparison limitations
Partial sample coverage. Self-identified breakfast, lunch, dinner and snacks; water-only occasions excluded. These are not current whole-population means.
Meal duration
Quantitative findingSurvey

Mean duration±standard deviation: breakfast 19±9, lunch 24±8 and dinner 35±17 min/day on consumption days with data.

Scope, method and limitations
Observation period
2016–2018
Unit
min/day, mean±SD
Population or sample
2681 adults aged 20–79, private-household volunteers; adult MINNADE component.
Geographic scope
32 prefectures; historical 2016–2018 data, not nationally representative.
Definition and method
Eight weighed dietary-record days, two nonconsecutive days per season; self-reported start and finish times.
Comparison limitations
Partial sample coverage. Self-identified breakfast, lunch, dinner and snacks; water-only occasions excluded. These are not current whole-population means. Consumption days only; n=2655 breakfast, 2676 lunch and 2679 dinner. These are not modal intervals or percentiles.
Daily energy distribution
Quantitative findingObserved intake

Dinner contributed a mean±standard deviation of 40·0±9·4% of daily energy intake.

Scope, method and limitations
Observation period
February–March 2003 and 2013
Unit
% daily energy intake, mean±SD
Population or sample
639 adults aged 20–81; two volunteer Japanese samples combined.
Geographic scope
Winter records, February–March 2003 and 2013; not a current national estimate.
Definition and method
Four nonconsecutive weighed dietary-record days; dinner energy contribution calculated for each participant and summarised as mean±standard deviation.
Comparison limitations
Partial coverage: only dinner is published here. Breakfast, lunch and snack percentages use denominators excluding nonconsumers; they must not be summed or normalised as a partition. Samples and years differ from MINNADE.
Weekdays and weekends
Quantitative findingSurvey

In 2006, mean breakfast start was 7:12 on weekdays, 7:33 on Saturday and 7:46 on Sunday.

Scope, method and limitations
Observation period
October 2006
Unit
h:min, mean start time
Population or sample
Residents of Japan aged 10 or older covered by the official survey; both sexes, total result.
Geographic scope
Historical national comparison for 2006. It does not describe current schedules and is not combined with the adult MINNADE sample.
Definition and method
Two-stage stratified sampling; two consecutive record days between 14 and 22 October 2006 in 15-minute intervals. Breakfast: first Meals activity starting between 4 and 11.
Comparison limitations
Partial historical coverage: breakfast start only, without weekend meal duration or count. The mean is not the modal time and is not interpreted as a time followed by the whole population.
Eating at home and away
Quantitative findingSurvey

In men, 76.2% of meals were recorded at home and 23.8% away; in women, 83.1% at home and 16.9% away.

Scope, method and limitations
Observation period
August–October 2021
Unit
% of recorded main meals
Population or sample
111 men and 111 women from volunteer cohabiting couples in 14 prefectures; men aged 30–76 and women aged 30–69.
Geographic scope
August–October 2021; 1295 male and 1317 female meals, pooling breakfast, lunch and dinner.
Definition and method
Four nonconsecutive weighed-record days: three weekdays and one weekend day. Location and companions recorded.
Comparison limitations
Percentage of recorded occasions, not people. Snowball sample of couples with Internet access; represents neither Japan nor people living alone. Family, friends and colleagues are not separated.
Cooking frequency
Quantitative findingSurvey

In the subgroup reporting increased preparation time and effort, 51.3% said they cooked almost every day.

Scope, method and limitations
Observation period
1–3 July 2020
Unit
% of increased-time-and-effort subgroup
Population or sample
Subgroup of 563 people from a voluntary panel of 2285 adults aged 20–69 in 13 special-alert prefectures.
Geographic scope
Survey on 1–3 July 2020 during the pandemic; this subgroup represents neither all participants nor Japan.
Definition and method
Internet questionnaire selecting for involvement in cooking or grocery shopping. Self-reported frequency stratified by changes in preparation time and effort from before the pandemic.
Comparison limitations
Partial coverage of a selected subgroup. Almost every day is a response category, not an exact number of days per week. Daily preparation minutes were not measured and no national frequency is calculated.
Eating together
Quantitative findingSurvey

In men, 42.9% of meals were alone and 57.1% with someone; in women, 29.9% alone and 70.1% with someone.

Scope, method and limitations
Observation period
August–October 2021
Unit
% of recorded main meals
Population or sample
111 men and 111 women from volunteer cohabiting couples in 14 prefectures; men aged 30–76 and women aged 30–69.
Geographic scope
August–October 2021; 1295 male and 1317 female meals, pooling breakfast, lunch and dinner.
Definition and method
Four nonconsecutive weighed-record days: three weekdays and one weekend day. Location and companions recorded.
Comparison limitations
Percentage of recorded occasions, not people. Snowball sample of couples with Internet access; represents neither Japan nor people living alone. Family, friends and colleagues are not separated.

Pantry and recipes

2/2
Pantry and recipes — Japan
IndicatorFindings and context
Most consumed ingredients
Quantitative findingObserved intake

Selected groups in 2024, mean±standard deviation: cereals 406.8±130.8 g/person/day and vegetables 249.6±118.0 g/person/day.

Scope, method and limitations
Observation period
2024
Unit
g/person/day, national corrected mean±SD
Population or sample
18457 participants from eligible households, aged 1 or older, both sexes.
Geographic scope
Nationally corrected results from the October–November 2024 survey; neither food supply nor purchases nor a complete ingredient ranking.
Definition and method
One-day weighed household record avoiding Sundays, holidays and unusual days; quantities apportioned among household members. Stratified area sampling; weighting for household participation by prefecture.
Comparison limitations
Partial coverage of two groups, without annualisation or raw-to-cooked weight conversion. National correction does not adjust the sex/age structure. Ineligible households and people are excluded; one autumn day does not describe each person’s usual intake or all seasons.
Ingredient prevalence in recipes
Qualitative descriptionRecipe sample

The sample includes short-grain rice, water and salt in onigiri; cabbage, dashi and flour in okonomiyaki; flour and cornstarch in tempura; anko in taiyaki and dorayaki; and miso, tofu and wakame in a vegetarian soup.

Scope, method and limitations
Observation period
Catalogue captured 2026-11-03
Population or sample
Six published Japanese recipes with Spanish translation in KitchenPause, captured on 3 November 2026.
Geographic scope
Editorial sample from the site catalogue; represents neither all Japanese dishes nor residents’ intake.
Definition and method
All published recipes attributed to Japan selected and deduplicated by stable identity. Visible ingredient lists read and checked against native ingredient rows.
Comparison limitations
Partial qualitative coverage: examples of combinations, without occurrence percentages or a quantitative ranking. No cooking-frequency, purchase or intake extrapolation.

Cereals and plant foods

6/6
Cereals and plant foods — Japan
IndicatorFindings and context
Cereals and cereal products
Quantitative findingObserved intake

In 2024, rice and rice products: 293.5±133.0 g/person/day; wheat and wheat products: 102.4±79.5 g/person/day (nationally corrected mean±standard deviation).

Scope, method and limitations
Observation period
2024
Unit
g/person/day, national corrected mean±SD
Population or sample
18457 participants from eligible households, aged 1 or older, both sexes.
Geographic scope
Nationally corrected results from the October–November 2024 survey; neither food supply nor purchases nor a complete ingredient ranking.
Definition and method
One-day weighed household record avoiding Sundays, holidays and unusual days; quantities apportioned among household members. Stratified area sampling; weighting for household participation by prefecture.
Comparison limitations
Only two selected subgroups; products are not all expressed on one common dry or cooked basis. without annualisation or raw-to-cooked weight conversion. National correction does not adjust the sex/age structure. Ineligible households and people are excluded; one autumn day does not describe each person’s usual intake or all seasons.
Bread
Quantitative findingObserved intake

In 2024, bread excluding sweet buns: 33.3±32.5 g/person/day; sweet buns: 4.7±16.7 g/person/day (nationally corrected mean±standard deviation).

Scope, method and limitations
Observation period
2024
Unit
g/person/day, national corrected mean±SD
Population or sample
18457 participants from eligible households, aged 1 or older, both sexes.
Geographic scope
Nationally corrected results from the October–November 2024 survey; neither food supply nor purchases nor a complete ingredient ranking.
Definition and method
One-day weighed household record avoiding Sundays, holidays and unusual days; quantities apportioned among household members. Stratified area sampling; weighting for household participation by prefecture.
Comparison limitations
The table does not detail bread varieties or recipes and ingredients. without annualisation or raw-to-cooked weight conversion. National correction does not adjust the sex/age structure. Ineligible households and people are excluded; one autumn day does not describe each person’s usual intake or all seasons.
Pulses
Quantitative findingObserved intake

In 2024, the legume and legume-product group: 60.1±57.5 g/person/day. Within it, tofu: 30.9±39.4; natto: 9.6±13.9 g/person/day (nationally corrected mean±standard deviation).

Scope, method and limitations
Observation period
2024
Unit
g/person/day, national corrected mean±SD
Population or sample
18457 participants from eligible households, aged 1 or older, both sexes.
Geographic scope
Nationally corrected results from the October–November 2024 survey; neither food supply nor purchases nor a complete ingredient ranking.
Definition and method
One-day weighed household record avoiding Sundays, holidays and unusual days; quantities apportioned among household members. Stratified area sampling; weighting for household participation by prefecture.
Comparison limitations
Includes soy and processed products; not a dry-pulse weight. Tofu and natto are already included in the total. without annualisation or raw-to-cooked weight conversion. National correction does not adjust the sex/age structure. Ineligible households and people are excluded; one autumn day does not describe each person’s usual intake or all seasons.
Vegetables
Quantitative findingObserved intake

In 2024, vegetables: 249.6±118.0 g/person/day. Within the group, onion: 32.3±29.8; cabbage: 28.8±36.6 g/person/day (nationally corrected mean±standard deviation).

Scope, method and limitations
Observation period
2024
Unit
g/person/day, national corrected mean±SD
Population or sample
18457 participants from eligible households, aged 1 or older, both sexes.
Geographic scope
Nationally corrected results from the October–November 2024 survey; neither food supply nor purchases nor a complete ingredient ranking.
Definition and method
One-day weighed household record avoiding Sundays, holidays and unusual days; quantities apportioned among household members. Stratified area sampling; weighting for household participation by prefecture.
Comparison limitations
The total includes vegetable juice and pickles. Onion and cabbage are included categories, not additional amounts; weekly frequency was not measured. without annualisation or raw-to-cooked weight conversion. National correction does not adjust the sex/age structure. Ineligible households and people are excluded; one autumn day does not describe each person’s usual intake or all seasons.
Fruit
Quantitative findingObserved intake

In 2024, fruit group: 76.4±79.2 g/person/day; its fresh-fruit subgroup: 67.5±71.9. Within fresh fruit, banana: 16.2±28.1; apple: 14.2±30.8 g/person/day (nationally corrected mean±standard deviation).

Scope, method and limitations
Observation period
2024
Unit
g/person/day, national corrected mean±SD
Population or sample
18457 participants from eligible households, aged 1 or older, both sexes.
Geographic scope
Nationally corrected results from the October–November 2024 survey; neither food supply nor purchases nor a complete ingredient ranking.
Definition and method
One-day weighed household record avoiding Sundays, holidays and unusual days; quantities apportioned among household members. Stratified area sampling; weighting for household participation by prefecture.
Comparison limitations
The total includes jam and fruit juice or fruit drinks. Fresh fruit, banana and apple are nested categories and must not be added together. without annualisation or raw-to-cooked weight conversion. National correction does not adjust the sex/age structure. Ineligible households and people are excluded; one autumn day does not describe each person’s usual intake or all seasons.
Potatoes, roots and tubers
Quantitative findingObserved intake

In 2024, tubers and their products, excluding the separate starch category: 45.3±47.7 g/person/day. Within the group, potato and products: 23.9±34.4; sweet potato and products: 8.0±21.3 g/person/day (nationally corrected mean±standard deviation).

Scope, method and limitations
Observation period
2024
Unit
g/person/day, national corrected mean±SD
Population or sample
18457 participants from eligible households, aged 1 or older, both sexes.
Geographic scope
Nationally corrected results from the October–November 2024 survey; neither food supply nor purchases nor a complete ingredient ranking.
Definition and method
One-day weighed household record avoiding Sundays, holidays and unusual days; quantities apportioned among household members. Stratified area sampling; weighting for household participation by prefecture.
Comparison limitations
Potato and sweet potato are already included in the group; their products are not necessarily raw roots. No separate cassava figure is provided. without annualisation or raw-to-cooked weight conversion. National correction does not adjust the sex/age structure. Ineligible households and people are excluded; one autumn day does not describe each person’s usual intake or all seasons.

Protein foods

5/5
Protein foods — Japan
IndicatorFindings and context
Meat
Quantitative findingObserved intake

In 2024, total meat: 106.3±63.9 g/person/day. Within the group, beef: 13.7±25.6; pork: 43.3±41.9; chicken: 35.4±46.1 g/person/day (nationally corrected mean±standard deviation).

Scope, method and limitations
Observation period
2024
Unit
g/person/day, national corrected mean±SD
Population or sample
18457 participants from eligible households, aged 1 or older, both sexes.
Geographic scope
Nationally corrected results from the October–November 2024 survey; neither food supply nor purchases nor a complete ingredient ranking.
Definition and method
One-day weighed household record avoiding Sundays, holidays and unusual days; quantities apportioned among household members. Stratified area sampling; weighting for household participation by prefecture.
Comparison limitations
The total includes other meats and products not detailed here. Subgroups are already included and must not be added to the total. Recorded intake, not carcass weight or supply. without annualisation or raw-to-cooked weight conversion. National correction does not adjust the sex/age structure. Ineligible households and people are excluded; one autumn day does not describe each person’s usual intake or all seasons.
Fish and seafood
Quantitative findingObserved intake

In 2024, total fish and shellfish: 59.1±50.0 g/person/day. Fresh subgroup: 34.6±41.4; processed: 24.5±30.0. Within fresh fish, salmon and trout: 5.4±15.6 g/person/day (nationally corrected mean±standard deviation).

Scope, method and limitations
Observation period
2024
Unit
g/person/day, national corrected mean±SD
Population or sample
18457 participants from eligible households, aged 1 or older, both sexes.
Geographic scope
Nationally corrected results from the October–November 2024 survey; neither food supply nor purchases nor a complete ingredient ranking.
Definition and method
One-day weighed household record avoiding Sundays, holidays and unusual days; quantities apportioned among household members. Stratified area sampling; weighting for household participation by prefecture.
Comparison limitations
Fresh and processed are food categories, not percentages eaten raw or cooked. Salmon and trout form one category included in fresh fish. No percentages are calculated. without annualisation or raw-to-cooked weight conversion. National correction does not adjust the sex/age structure. Ineligible households and people are excluded; one autumn day does not describe each person’s usual intake or all seasons.
Eggs
Quantitative findingObserved intake

In 2024, the egg group recorded 41.4±29.4 g/person/day (nationally corrected mean±standard deviation).

Scope, method and limitations
Observation period
2024
Unit
g/person/day, national corrected mean±SD
Population or sample
18457 participants from eligible households, aged 1 or older, both sexes.
Geographic scope
Nationally corrected results from the October–November 2024 survey; neither food supply nor purchases nor a complete ingredient ranking.
Definition and method
One-day weighed household record avoiding Sundays, holidays and unusual days; quantities apportioned among household members. Stratified area sampling; weighting for household participation by prefecture.
Comparison limitations
Daily group mass only, without conversion to egg counts or kg/person/year. Does not describe types or weekly frequency. without annualisation or raw-to-cooked weight conversion. National correction does not adjust the sex/age structure. Ineligible households and people are excluded; one autumn day does not describe each person’s usual intake or all seasons.
Milk and dairy products
Quantitative findingObserved intake

In 2024, total dairy group: 128.2±111.2 g/person/day. Within it, milk: 79.7±91.6; cheese: 3.9±7.1; fermented milk and lactic acid bacteria drinks: 36.8±49.2 g/person/day (nationally corrected mean±standard deviation).

Scope, method and limitations
Observation period
2024
Unit
g/person/day, national corrected mean±SD
Population or sample
18457 participants from eligible households, aged 1 or older, both sexes.
Geographic scope
Nationally corrected results from the October–November 2024 survey; neither food supply nor purchases nor a complete ingredient ranking.
Definition and method
One-day weighed household record avoiding Sundays, holidays and unusual days; quantities apportioned among household members. Stratified area sampling; weighting for household participation by prefecture.
Comparison limitations
Subgroups are already included in the total. The fermented category combines products and drinks and is not yoghurt alone. Milk grams are not converted to millilitres. without annualisation or raw-to-cooked weight conversion. National correction does not adjust the sex/age structure. Ineligible households and people are excluded; one autumn day does not describe each person’s usual intake or all seasons.
Protein sources
Quantitative findingObserved intake

In 2024, animal protein accounted for 55.0±9.9% of total protein (nationally corrected mean±standard deviation of individual proportions).

Scope, method and limitations
Observation period
2024
Unit
% of total protein, national corrected mean±SD of individual ratios
Population or sample
18457 participants from eligible households, aged 1 or older, both sexes.
Geographic scope
Nationally corrected results from the October–November 2024 survey; neither food supply nor purchases nor a complete ingredient ranking.
Definition and method
One-day weighed household record avoiding Sundays, holidays and unusual days; quantities apportioned among household members. Stratified area sampling; weighting for household participation by prefecture.
Comparison limitations
Partial coverage of protein sources: aggregated animal share only, without separate meat, fish, egg, dairy or legume shares. Mean of individual percentages, not a ratio of mean gram intakes. No plant share calculated by subtraction. without annualisation or raw-to-cooked weight conversion. National correction does not adjust the sex/age structure. Ineligible households and people are excluded; one autumn day does not describe each person’s usual intake or all seasons.

Fats, flavours and condiments

3/3
Fats, flavours and condiments — Japan
IndicatorFindings and context
Cooking fats
Quantitative findingObserved intake

In 2024, the oils and fats group recorded 11.4±7.6 g/person/day; within it, vegetable oils and fats: 9.2±6.8; butter: 1.1±2.3 g/person/day (nationally corrected mean±standard deviation).

Scope, method and limitations
Observation period
2024
Unit
g/person/day, national corrected mean±SD
Population or sample
18457 participants from eligible households, aged 1 or older, both sexes.
Geographic scope
Nationally corrected results from the October–November 2024 survey; neither food supply nor purchases nor a complete ingredient ranking.
Definition and method
One-day weighed household record avoiding Sundays, holidays and unusual days; quantities apportioned among household members. Stratified area sampling; weighting for household participation by prefecture.
Comparison limitations
This is a food group, not total dietary fat as a nutrient. It does not distinguish specific vegetable oils or use frequency; subgroups are already included in the total. It does not establish that the population avoids cooking with fat. without annualisation or raw-to-cooked weight conversion. National correction does not adjust the sex/age structure. Ineligible households and people are excluded; one autumn day does not describe each person’s usual intake or all seasons.
Herbs and spices
Qualitative descriptionCultural context

In Kyoto, chirimen-sansho combines small dried fish with green sansho fruit; in Hyogo, sansho is simmered with soy sauce, sake and mirin to make tsukudani. The catalogue’s Osaka okonomiyaki includes pickled ginger.

Scope, method and limitations
Observation period
Undated regional descriptions; catalogue checked 2026-11-03
Population or sample
Regional archives from Kyoto and Hyogo and one catalogue recipe, checked against six published Japanese recipes on 3 November 2026.
Geographic scope
Documented regional examples and one editorial example from the site recipe catalogue.
Definition and method
Regional archive ingredients and uses read; okonomiyaki ingredient list checked against its public recipe page.
Comparison limitations
Partial qualitative coverage: does not measure national or sample herb/spice prevalence, frequency or use amounts. Historical descriptions are not recast as general current practices.
Sauces and condiments
Quantitative findingObserved intake

In 2024, soy sauce: 10.7±8.5 g/person/day; miso: 9.5±8.1 g/person/day (nationally corrected mean±standard deviation). One specific regional use is simmering sansho with soy sauce, sake and mirin to make tsukudani in Hyogo.

Scope, method and limitations
Observation period
2024
Unit
g/person/day, national corrected mean±SD
Population or sample
18457 participants from eligible households, aged 1 or older, both sexes.
Geographic scope
Nationally corrected results from the October–November 2024 survey; neither food supply nor purchases nor a complete ingredient ranking.
Definition and method
One-day weighed household record avoiding Sundays, holidays and unusual days; quantities apportioned among household members. Stratified area sampling; weighting for household participation by prefecture.
Comparison limitations
These are product masses, not grams of salt or sodium. No contribution to total salt or dish composition is calculated or generalized. The usage example is regional and qualitative, not a national frequency. without annualisation or raw-to-cooked weight conversion. National correction does not adjust the sex/age structure. Ineligible households and people are excluded; one autumn day does not describe each person’s usual intake or all seasons.

Meal composition

6/6
Meal composition — Japan
IndicatorFindings and context
Breakfast composition
Quantitative findingObserved intake

Mean±standard deviation attributed to breakfast: rice 66·9±70·1; bread 28·2±29·9; dairy products 65·4±76·9 g/person/day.

Scope, method and limitations
Observation period
2003 and 2013
Unit
g/person/day attributed to meal, mean±SD
Population or sample
639 adults aged 20–81; two volunteer Japanese samples combined.
Geographic scope
Winter records, February–March 2003 and 2013; not a current national estimate.
Definition and method
Four nonconsecutive weighed dietary-record days; dinner energy contribution calculated for each participant and summarised as mean±standard deviation.
Comparison limitations
Daily per-capita amounts attributed to this meal type, not grams per serving or a compulsory menu. Includes people who did not consume that food; the sample does not represent the current whole population. Partial coverage: only dinner is published here. Breakfast, lunch and snack percentages use denominators excluding nonconsumers; they must not be summed or normalised as a partition. Samples and years differ from MINNADE.
Main meal composition
Qualitative descriptionCultural context

An ichiju-sansai meal composition brings together rice, soup, a main dish and two side dishes.

Scope, method and limitations
Observation period
Undated culinary composition model
Population or sample
General culinary description, without a surveyed population.
Geographic scope
Cultural meal-composition model, not necessarily assigned to lunch or dinner.
Definition and method
Official description of meal composition read.
Comparison limitations
Partial qualitative coverage; no frequency, quantities, specific dishes or universal current menu established.
Dinner composition
Quantitative findingObserved intake

Mean±standard deviation attributed to dinner: rice 133·7±73·6; total vegetables 142·5±74·5; fish, including shellfish 45·3±34·8 g/person/day.

Scope, method and limitations
Observation period
2003 and 2013
Unit
g/person/day attributed to meal, mean±SD
Population or sample
639 adults aged 20–81; two volunteer Japanese samples combined.
Geographic scope
Winter records, February–March 2003 and 2013; not a current national estimate.
Definition and method
Four nonconsecutive weighed dietary-record days; dinner energy contribution calculated for each participant and summarised as mean±standard deviation.
Comparison limitations
Daily per-capita amounts attributed to this meal type, not grams per serving or a compulsory menu. Includes people who did not consume that food; the sample does not represent the current whole population. Partial coverage: only dinner is published here. Breakfast, lunch and snack percentages use denominators excluding nonconsumers; they must not be summed or normalised as a partition. Samples and years differ from MINNADE.
Appetisers and snacks
Quantitative findingObserved intake

Mean±standard deviation attributed to snacks: confectioneries 28·3±31·8; fruit 13·4±28·6; dairy products 23·3±45·0 g/person/day.

Scope, method and limitations
Observation period
2003 and 2013
Unit
g/person/day attributed to meal, mean±SD
Population or sample
639 adults aged 20–81; two volunteer Japanese samples combined.
Geographic scope
Winter records, February–March 2003 and 2013; not a current national estimate.
Definition and method
Four nonconsecutive weighed dietary-record days; dinner energy contribution calculated for each participant and summarised as mean±standard deviation.
Comparison limitations
Daily per-capita amounts attributed to this meal type, not grams per serving or a compulsory menu. Includes people who did not consume that food; the sample does not represent the current whole population. Partial coverage: only dinner is published here. Breakfast, lunch and snack percentages use denominators excluding nonconsumers; they must not be summed or normalised as a partition. Samples and years differ from MINNADE.
Desserts and sweets
Quantitative findingObserved intake

In 2024, all confectioneries: 24.4±32.4 g/person/day; within the group, Japanese confectioneries: 9.1±18.7; cakes and pastries: 5.9±16.7 g/person/day (nationally corrected mean±standard deviation).

Scope, method and limitations
Observation period
2024
Unit
g/person/day, nationally corrected mean±SD
Population or sample
18457 participants from eligible households, aged 1 or older, both sexes.
Geographic scope
Nationally corrected results from the October–November 2024 survey; neither food supply nor purchases nor a complete ingredient ranking.
Definition and method
One-day weighed household record avoiding Sundays, holidays and unusual days; quantities apportioned among household members. Stratified area sampling; weighting for household participation by prefecture.
Comparison limitations
Whole-day intake, not exclusively desserts after a meal; subgroups already included, without addition to the total. No frequency per occasion measured. Partial coverage of two groups, without annualisation or raw-to-cooked weight conversion. National correction does not adjust the sex/age structure. Ineligible households and people are excluded; one autumn day does not describe each person’s usual intake or all seasons.
Portion sizes
Quantitative findingCultural context

As a guideline reference serving, one SV of vegetable dishes corresponds to about 70 g of main ingredients and one fruit SV to about 100 g. These are not observed household portions.

Scope, method and limitations
Observation period
2005 guide model; English interpretation undated
Unit
g of main ingredients per reference SV; guidance, not observed
Population or sample
Educational reference, without an intake sample.
Geographic scope
Guide model adopted in 2005; the consulted English interpretation has no stated date.
Definition and method
SV definitions read, not calculated from surveys.
Comparison limitations
Partial guideline coverage: vegetable-dish ingredients include vegetables, potatoes, beans except soybeans, mushrooms and seaweed. Not total dish weight, an observed portion or personal dietary advice.

Techniques and equipment

5/5
Techniques and equipment — Japan
IndicatorFindings and context
Cooking techniques
Qualitative descriptionCultural context

In Kyoto, chirimen-sansho is prepared by dry-roasting small fish and then simmering them with sansho, stock, sake, mirin and soy sauce until the broth is gone.

Scope, method and limitations
Observation period
Undated regional culinary description
Population or sample
Documented regional preparation, without a population sample.
Geographic scope
Kyoto
Definition and method
Ingredients, operations and limits in the regional entry read.
Comparison limitations
Partial qualitative coverage of one regional example, without household, recipe or consumption percentages. Does not establish national frequency or storage life.
Vegetable preparation
Qualitative descriptionCultural context

Kyoto senmaizuke uses thinly sliced Shogoin turnip pickled with vinegar, kombu and chilli. The described version is neither a long-storage pickle nor a lactic fermentation.

Scope, method and limitations
Observation period
Undated regional culinary description
Population or sample
Documented regional preparation, without a population sample.
Geographic scope
Kyoto
Definition and method
Ingredients, operations and limits in the regional entry read.
Comparison limitations
Partial qualitative coverage of one regional example, without household, recipe or consumption percentages. Does not establish national frequency or storage life.
Food preservation
Qualitative descriptionCultural context

The regional Hyogo sansho preparation describes blanching, draining and cooling the fruit, then dividing it into small portions, wrapping and freezing it for use in other preparations.

Scope, method and limitations
Observation period
Undated regional culinary description
Population or sample
Documented regional preparation, without a population sample.
Geographic scope
Hyogo
Definition and method
Ingredients, operations and limits in the regional entry read.
Comparison limitations
Partial qualitative coverage of one regional example, without household, recipe or consumption percentages. Does not establish national frequency or storage life.
Fermented foods
Quantitative findingObserved intake

In 2024, miso: 9.5±8.1 and natto: 9.6±13.9 g/person/day (nationally corrected mean±standard deviation). Miso is made by mixing steamed soybeans with koji and salt; koji may be based on rice, barley or soybeans.

Scope, method and limitations
Observation period
2024
Unit
g/person/day, national corrected mean±SD
Population or sample
18457 participants from eligible households, aged 1 or older, both sexes.
Geographic scope
Nationally corrected results from the October–November 2024 survey; neither food supply nor purchases nor a complete ingredient ranking.
Definition and method
One-day weighed household record avoiding Sundays, holidays and unusual days; quantities apportioned among household members. Stratified area sampling; weighting for household participation by prefecture.
Comparison limitations
Two selected fermented foods; not consumption frequency, the share of fermenting households or all fermented-food intake. The production description is not a complete recipe. Partial coverage of two groups, without annualisation or raw-to-cooked weight conversion. National correction does not adjust the sex/age structure. Ineligible households and people are excluded; one autumn day does not describe each person’s usual intake or all seasons.
Kitchen equipment
Quantitative findingSurvey

In March 2026, 36.6% of households with two or more people owned a dishwasher.

Scope, method and limitations
Observation period
2026
Unit
% of eligible two-or-more-person households owning dishwasher
Population or sample
Eligible households with two or more people in Japan; excludes foreign, student and institutional-resident households.
Geographic scope
Dishwasher ownership; table labels end-March and the survey reference date is the 15th.
Definition and method
Three-stage municipality, area and household sample; postal or online responses. Each owning household counted once even if it owns several units.
Comparison limitations
Partial equipment coverage: excludes single-person households and does not measure ovens, microwaves or pressure cookers. Ownership is not use. Responses vary by item; the overall maximum response count is not taken as the dishwasher denominator.

Drinks

3/3
Drinks — Japan
IndicatorFindings and context
Everyday drinks
Quantitative findingObserved intake

In 2024, the beverage category in Table: 570.4±370.4 g/person/day; its alcoholic-beverage subgroup: 90.9±187.1 g/person/day (national corrected mean±standard deviation).

Scope, method and limitations
Observation period
2024
Unit
g/person/day, national corrected mean±SD
Population or sample
18457 participants from eligible households, aged 1 or older, both sexes.
Geographic scope
Nationally corrected results from the October–November 2024 survey; neither food supply nor purchases nor a complete ingredient ranking.
Definition and method
One-day weighed household record avoiding Sundays, holidays and unusual days; quantities apportioned among household members. Stratified area sampling; weighting for household participation by prefecture.
Comparison limitations
Partial coverage of food categories defined in the table; the alcoholic subgroup is already included in the total. Does not measure total hydration or identify water separately. Coffee and cocoa remain combined. Grams are not converted to millilitres or cups; no frequency or added sugar/milk inferred. Partial coverage of two groups, without annualisation or raw-to-cooked weight conversion. National correction does not adjust the sex/age structure. Ineligible households and people are excluded; one autumn day does not describe each person’s usual intake or all seasons.
Coffee and tea preparation
Quantitative findingObserved intake

In 2024, tea: 189.3±231.2; coffee and cocoa combined: 132.9±142.0 g/person/day (national corrected mean±standard deviation).

Scope, method and limitations
Observation period
2024
Unit
g/person/day, national corrected mean±SD
Population or sample
18457 participants from eligible households, aged 1 or older, both sexes.
Geographic scope
Nationally corrected results from the October–November 2024 survey; neither food supply nor purchases nor a complete ingredient ranking.
Definition and method
One-day weighed household record avoiding Sundays, holidays and unusual days; quantities apportioned among household members. Stratified area sampling; weighting for household participation by prefecture.
Comparison limitations
Partial coverage of food categories defined in the table; the alcoholic subgroup is already included in the total. Does not measure total hydration or identify water separately. Coffee and cocoa remain combined. Grams are not converted to millilitres or cups; no frequency or added sugar/milk inferred. Partial coverage of two groups, without annualisation or raw-to-cooked weight conversion. National correction does not adjust the sex/age structure. Ineligible households and people are excluded; one autumn day does not describe each person’s usual intake or all seasons.
Drinks with meals
Quantitative findingObserved intake

Non-energetic beverages attributed to breakfast 185·1±151·3, lunch 172·8±125·6 and dinner 139·2±122·1 g/person/day (mean±standard deviation).

Scope, method and limitations
Observation period
2003 and 2013
Unit
g/person/day attributed to meal, mean±SD
Population or sample
639 adults aged 20–81; two volunteer Japanese samples combined.
Geographic scope
Winter records, February–March 2003 and 2013; not a current national estimate.
Definition and method
Four nonconsecutive weighed-record days, three working and one non-working; meals labelled by participants. Four-day participant averages, including nonconsumers.
Comparison limitations
Partial historical coverage of a nonrandom sample: daily amounts assigned to meals, not grams per occasion or percentages of people. Water-only occasions were excluded from eating-occasion definition; no total hydration or current national preferences can be measured.

Nutrition and dietary patterns

3/3
Nutrition and dietary patterns — Japan
IndicatorFindings and context
Energy and nutrients
Quantitative findingObserved intake

In 2024, energy 1859±425 kcal/person/day; protein 70.6±18.5, fat 60.3±19.3, carbohydrate 241.5±58.6 and fibre 17.7±5.1 g/person/day (national corrected mean±standard deviation).

Scope, method and limitations
Observation period
2024
Unit
kcal/person/day and g/person/day, national corrected mean±SD
Population or sample
18457 participants from eligible households, aged 1 or older, both sexes.
Geographic scope
Nationally corrected results from the October–November 2024 survey; neither food supply nor purchases nor a complete ingredient ranking.
Definition and method
One-day weighed household record avoiding Sundays, holidays and unusual days; quantities apportioned among household members. Stratified area sampling; weighting for household participation by prefecture.
Comparison limitations
Observed intake, not recommendations or food supply. One autumn day does not measure usual annual intake; national correction does not adjust age/sex structure.
Salt and sugars
Quantitative findingObserved intake

In 2024, sodium 3682±1130 mg/person/day and salt equivalent 9.4±2.9 g/person/day (national corrected means±standard deviation). In a 2016 adult subsample, free sugars: men 4.8±3.9% and women 5.8±4.2% of daily energy.

Scope, method and limitations
Observation period
2024 salt/sodium;2016 free sugars
Unit
mg or g/person/day; % daily energy, mean±SD
Population or sample
Salt/sodium: 18457 eligible participants aged 1+. Free sugars: 9865 adults aged 20+, 4071 men and 5794 women; pregnant/lactating women and participants with incomplete data excluded.
Geographic scope
Two different survey populations: October–November 2024 and 2016; not a comparable time series.
Definition and method
One-day weighed household records, apportioned among members. Free sugars estimated using a composition database: added sugars plus those in honey, syrups, juices and concentrates; expressed as energy percentage.
Comparison limitations
Partial coverage: free sugars differ from total and added sugars. The 2016 subsample required complete clinical data and is not the whole national sample. One day does not measure usual intake. Salt equivalent was calculated by the source; sodium is not converted here or added to salt.
Dietary patterns
Quantitative findingSurvey

In March 2023, 5.9% of the sample reported a diet without meat or fish, the combined vegetarian or vegan category.

Scope, method and limitations
Observation period
2023 (10–11 March)
Unit
% valid Japanese online-panel respondents
Population or sample
887 Japanese participants aged 18–25 registered in an online panel.
Geographic scope
Japanese survey on 10–11 March 2023; sample from a meat-alternatives study.
Definition and method
Self-reported dietary preference before the choice experiment; valid responses after excluding comprehension-test failures.
Comparison limitations
Partial coverage: not national prevalence or a record of food consumed. The combined no-meat-or-fish definition is retained; no further criteria or national vegan/flexitarian percentages inferred.

Shopping, prices and waste

7/7
Shopping, prices and waste — Japan
IndicatorFindings and context
Food expenditure
Quantitative findingPurchases

Mean food spending: 94895 JPY per household per month. The Engel coefficient is 28.6%; definitions differ: spending includes gifts and services to other households, whereas the coefficient’s food numerator excludes them.

Scope, method and limitations
Observation period
2025
Unit
JPY/household/month; % consumption expenditure
Population or sample
Japanese households with two or more persons; not individual people.
Geographic scope
Monthly average for calendar year 2025 in the household budget survey.
Definition and method
Household income and expenditure records. Category means include households with no such spending. Food spending includes gifts and services to other households; the Engel coefficient’s food numerator excludes them.
Comparison limitations
Partial coverage: no per-person spending is calculated by dividing by mean household size. Do not divide this spending by total consumption to derive the Engel coefficient: definitions differ.
Cost of a common basket
Quantitative findingSurvey

As a historical fixed-quantity menu example, the MIS model for a Japanese schoolboy budgeted 8914 JPY per week. Ingredients and meals bought outside are included: not an ingredient-only grocery basket or observed spending.

Scope, method and limitations
Observation period
2011 (historical priced menu model)
Unit
JPY/week; fixed-quantity model including prepared/purchased meals
Population or sample
Model of a boy in the third year of Japanese junior high school; neither a pupil average nor an intake sample.
Geographic scope
Mitaka and the Tokyo area. Food prices collected on 20 January 2011 at Seiyu Kichijoji, Musashino; purchased meals priced at Mitaka establishments or online.
Definition and method
Consensus menu reviewed by a nutrition specialist; fixed food list with usage quantities, weights, packs, unit prices and amounts. Published weekly total adopted without recalculating quantities, waste or monthly conversions.
Comparison limitations
Partial historical coverage of one model combining ingredients and prepared meals. Neither a current national basket nor a recommended threshold. Do not compare with baskets for other pupils or adults containing different foods or quantities.
Cost of specific meals
Quantitative findingPurchases

Yoshinoya’s regular-size gyudon (並盛) is listed at 498 JPY for dining in and 489 JPY for takeout, including tax. These are prices for one chain and dish, not a national average.

Scope, method and limitations
Observation period
2026 (menu observation; not effective price-change date)
Unit
JPY/serving, tax included
Population or sample
One regular-size gyudon (並盛), per serving; Yoshinoya’s Japanese menu.
Geographic scope
Japan, menu observed on 3 November 2026. An official October campaign distinguishes regular and promotional prices; that promotion ended.
Definition and method
Official tax-inclusive menu prices read separately for dine-in and takeout. Regular menu size retained without assigning an unpublished portion weight.
Comparison limitations
Partial coverage of one chain and dish. Some outlets and delivery have different prices. The menu has no effective date; observation is not presented as the price-change date.
Grocery shopping locations
Quantitative findingSurvey

In the online panel, 75.0% reported usually using food supermarkets and 15.5% some internet channel. Multiple answers were allowed: these are usage percentages, not spending shares or mutually exclusive categories.

Scope, method and limitations
Observation period
2025
Unit
% panel respondents, multiple responses
Population or sample
4000 online panellists aged 15–74; sex, age and regional quotas.
Geographic scope
Nine areas of Japan; survey on 21–25 November 2025.
Definition and method
Multiple-response question on usual ingredient, food and drink shopping locations. Quotas based on the 2019 resident register; market-research, media and civil-service professionals excluded.
Comparison limitations
Partial coverage: reported use, not food-spending share. Quota panel, not a national probability sample. Overlapping categories; do not sum percentages or compare years with different categories.
Shopping frequency
Quantitative findingSurvey

In the November 2025 online survey, 37.2% of food purchasers reported shopping two or three days a week and 29.2% about one day. This question covered 1962 people aged 20–79; these are neither mean visits nor mean basket spending.

Scope, method and limitations
Observation period
2025
Unit
% food purchasers
Population or sample
Online survey of 2068 adults aged 20–79; frequency question based on 1962 food purchasers.
Geographic scope
Japan; fieldwork on 25–28 November 2025.
Definition and method
Supermarket association’s original consumer survey, conducted by Intage Research. Responses distributed across weekly shopping-day bands.
Comparison limitations
Partial coverage: purchasers’ reported days, not mean visits. No mean frequency or mean basket spending calculated. An online panel does not establish probability-sample representativeness.
Prepared food and delivery
Quantitative findingSurvey

In the June 2025 panel subgroup, 81.7% bought commercially prepared food at least monthly. The study covered two metropolitan regions and included takeout and delivery; it estimates neither national prevalence nor separate delivery frequency.

Scope, method and limitations
Observation period
2025
Unit
% age60–69 subgroup, at least monthly
Population or sample
Subgroup aged 60–69; online screening of 10000 people aged 20–79. Subgroup denominator not derived by adding other cells.
Geographic scope
Tokyo, Saitama, Chiba and Kanagawa, plus six Kinki prefectures; 5–10 June 2025.
Definition and method
Weight-back by age, household structure and region. Commercially prepared food eaten away from its purchase location, ready to eat, reheat or thaw; includes takeout and delivery.
Comparison limitations
Partial regional coverage: neither national prevalence nor separate delivery frequency. Follow-up of 2000 monthly users is another sample. Oil-manufacturer research; no health effects inferred.
Household food waste
Quantitative findingSurvey

Estimated edible household food loss: 2235 thousand tonnes per year. The report gives 961 for direct disposal, 350 for excessive removal of edible parts and 925 for plate leftovers, in the same unit; rounded components do not exactly sum to the total.

Scope, method and limitations
Observation period
2024 (fiscal year)
Unit
thousand tonnes/year; edible household food loss
Population or sample
Households in Japan; national estimate of edible household waste.
Geographic scope
Fiscal year 2024. Business waste and inedible parts excluded; not a per-person figure.
Definition and method
Accepted municipal estimates are combined with extrapolations for other municipalities. Ratios come from current composition audits or the latest previously accepted data, using simple means and excluding outliers.
Comparison limitations
Partial indicator coverage: annual mass, without monetary cost or a per-capita calculation. Not a weighed census of every household. Intermediate extrapolation ratios are not shares of the national total; retain original rounding.

Seasons and celebrations

2/2
Seasons and celebrations — Japan
IndicatorFindings and context
Seasonal produce
Qualitative descriptionCultural context

In Kyoto, senmaizuke is made around November, when Shogoin turnips are ready for shipment. It is also made at home during this turnip’s harvest season.

Scope, method and limitations
Observation period
Undated regional culinary description
Population or sample
Documented regional culinary practice; not a population survey.
Geographic scope
Kyoto, Japan; cultural description without a statistical observation date.
Definition and method
Regional description, calendar and ingredients read; no frequency or prevalence estimated.
Comparison limitations
Partial qualitative coverage of one turnip and one Kyoto preparation. Not a complete national calendar or a measure of imported availability or current purchases.
Celebration food
Qualitative descriptionCultural context

In Kyoto, New Year’s Day is associated with Daifuku tea: pickled plums and knotted kombu are placed in a cup and tea is poured over them.

Scope, method and limitations
Observation period
Undated regional culinary description
Population or sample
Documented regional culinary practice; not a population survey.
Geographic scope
Kyoto, Japan; cultural description without a statistical observation date.
Definition and method
Regional description, calendar and ingredients read; no frequency or prevalence estimated.
Comparison limitations
Partial qualitative coverage of one regional custom; establishes neither universal household practice nor a health benefit. Does not cover all national celebrations.

Coverage in progress

The editorial guide for this country is in preparation. You can already explore its recipes; regional attributions are added when documented.

Guide available in other languages: Español

Places and communities

One country, many cuisines

An initial selection of regions to explore. Culinary boundaries may differ from administrative divisions.

Japan

Hokkaido

Japan

Kioto

Japan

Okinawa

Cook

Recipes connected with Japan

Each recipe documents one version. Geographic associations do not imply an exclusive origin.
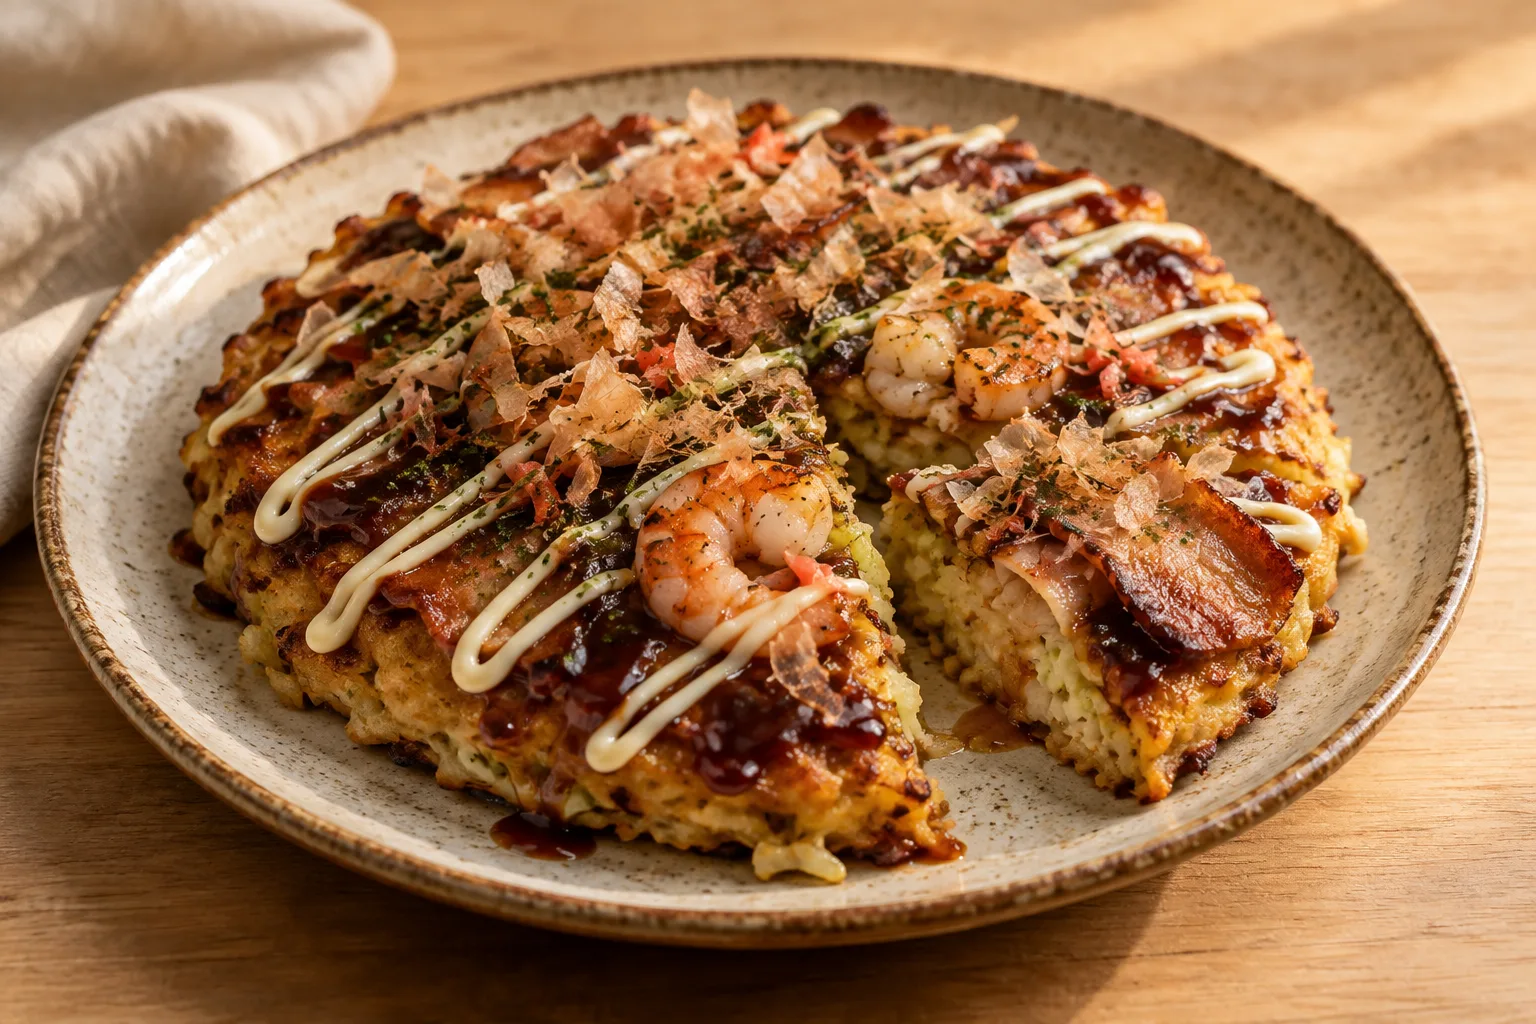
Osaka-style Okonomiyaki
Image generated by the Kitchenpause team
60 minIntermediate

Osaka-style Okonomiyaki

Japanese cabbage pancakes with shrimp and pork belly, served with homemade okonomiyaki sauce. Makes 4 servings.

View recipe

Sources consulted

Read the sources and each document’s scope. A heritage inscription concerns a particular practice, not all of a country’s cuisine.

  1. 令和6年国民健康・栄養調査 栄養摂取状況(第1表の1・第5表の1) www.mhlw.go.jp/content/001675212.pdf Ministry of Health, Labour and Welfare, Japan Consulted: November 3, 2026
  2. 2024年 国民健康・栄養調査 表5-1 official metadata www.e-stat.go.jp/stat-search/files?cycle=7&layout=datalist&month=0&page=1&tclass1=0000012475… e-Stat / MHLW Consulted: November 3, 2026
  3. 令和6年国民健康・栄養調査 調査の概要 www.mhlw.go.jp/content/001675210.pdf Ministry of Health, Labour and Welfare, Japan Consulted: November 3, 2026
  4. Chirimen Sansho — Kyoto City www.maff.go.jp/e/policies/market/dento_syoku/menu/tirimen_sansyo.html Ministry of Agriculture, Forestry and Fisheries, Japan Consulted: November 3, 2026
  5. Sansho no Tsukudani — Hyogo Prefecture www.maff.go.jp/e/policies/market/k_ryouri/search_menu/4878/index.html Ministry of Agriculture, Forestry and Fisheries, Japan Consulted: November 3, 2026
  6. Okonomiyaki de Osaka www.kitchenpause.com/es/recetas/okonomiyaki-de-osaka KitchenPause Consulted: November 3, 2026
  7. Eating patterns in a nationwide sample of Japanese aged 1–79 years from MINNADE study: eating frequency, clock time for eating, time spent on eating and variability of eating patterns europepmc.org/articles/PMC9991801 Public Health Nutrition Consulted: November 3, 2026
  8. Association between meal context and meal quality: an ecological momentary assessment in Japanese adults europepmc.org/articles/PMC11377557 European Journal of Nutrition Consulted: November 3, 2026
  9. Characterisation of breakfast, lunch, dinner and snacks in the Japanese context: an exploratory cross-sectional analysis europepmc.org/articles/PMC9991704 Public Health Nutrition Consulted: November 3, 2026
  10. Factors Influencing Changes in Food Preparation during the COVID-19 Pandemic and Associations with Food Intake among Japanese Adults europepmc.org/articles/PMC8620480 Nutrients Consulted: November 3, 2026
  11. 2006 Survey on Time Use and Leisure Activities: Summary of Results, Questionnaire A www.stat.go.jp/english/data/shakai/2006/pdf/jikan-a.pdf Statistics Bureau of Japan Consulted: November 3, 2026
  12. Outline of the 2006 Survey on Time Use and Leisure Activities www.stat.go.jp/english/data/shakai/2006/gaiyo.htm Statistics Bureau of Japan Consulted: November 3, 2026
  13. Taiyaki japonés relleno de anko www.kitchenpause.com/es/recetas/taiyaki-japones-relleno-de-anko KitchenPause Consulted: November 3, 2026
  14. Tempura japonesa de verduras www.kitchenpause.com/es/recetas/tempura-japonesa-de-verduras KitchenPause Consulted: November 3, 2026
  15. Dorayaki japonés con anko www.kitchenpause.com/es/recetas/dorayaki-japones-con-anko KitchenPause Consulted: November 3, 2026
  16. Onigiri japonés sencillo www.kitchenpause.com/es/recetas/onigiri-japones-sencillo KitchenPause Consulted: November 3, 2026
  17. Sopa de miso vegetariana con tofu y wakame www.kitchenpause.com/es/recetas/sopa-de-miso-vegetariana-con-tofu-y-wakame KitchenPause Consulted: November 3, 2026
  18. Japanese Cuisine — ichiju sansai www.maff.go.jp/e/policies/market/japan-cuisine/index.html Ministry of Agriculture, Forestry and Fisheries, Japan Consulted: November 3, 2026
  19. Interpretation of Japanese food guide spinning top — standard reference servings www.maff.go.jp/j/balance_guide/attach/pdf/index-1.pdf Ministry of Agriculture, Forestry and Fisheries, Japan Consulted: November 3, 2026
  20. FY2005 Annual Report — guide adoption in June2005, Table3 www.maff.go.jp/e/pdf/fy2005_rep.pdf Ministry of Agriculture, Forestry and Fisheries, Japan Consulted: November 3, 2026
  21. Senmaizuke — Kyoto www.maff.go.jp/e/policies/market/k_ryouri/search_menu/1900/index.html Ministry of Agriculture, Forestry and Fisheries, Japan Consulted: November 3, 2026
  22. Soy sauce, miso and other seasonings — types and production www.maff.go.jp/e/policies/market/dento_syoku/bunrui/syouyu-miso.html Ministry of Agriculture, Forestry and Fisheries, Japan Consulted: November 3, 2026
  23. Consumer Confidence Survey March2026 — methods and Table3 household durable ownership www.esri.cao.go.jp/jp/stat/shouhi/honbun202603.pdf Economic and Social Research Institute, Cabinet Office, Japan Consulted: November 3, 2026
  24. Association of Free Sugars Intake with Cardiometabolic Risk Factors among Japanese Adults: The2016National Health and Nutrition Survey,Japan europepmc.org/articles/PMC7761430 Nutrients / original research Consulted: November 3, 2026
  25. Young consumers’ perceptions of and preferences for alternative meats: an empirical study in Japan and China www.frontiersin.org/journals/sustainable-food-systems/articles/10.3389/fsufs.2023.1290131/fu… Frontiers in Sustainable Food Systems / original research Consulted: November 3, 2026
  26. How to brew and enjoy delicious Uji tea — Daifuku tea on New Year’s Day www.ujicha.or.jp/en/knowledge/howto/ Kyoto Prefectural Tea Industry Chamber Consulted: November 3, 2026
  27. 家計調査報告 家計収支編 2025年平均結果の概要 www.stat.go.jp/data/kakei/sokuhou/tsuki/pdf/fies_gaikyo2025.pdf Statistics Bureau of Japan Consulted: November 3, 2026
  28. MIS法を用いた最低生活水準の推計 — 食費の価格調査方法 mhlw-grants.niph.go.jp/system/files/2010/101011/201001049A/201001049A0008.pdf MHLW-funded original MIS research; Iwata, Abe and colleagues Consulted: November 3, 2026
  29. MIS法を用いた最低生活水準の推計 — 中学3年生男子の固定献立・食費計算 mhlw-grants.niph.go.jp/system/files/2010/101011/201001049A/201001049A0011.pdf MHLW-funded original MIS research; Iwata, Abe and colleagues Consulted: November 3, 2026
  30. 牛丼 — 店内・テイクアウト価格 www.yoshinoya.com/menu/gyudon/gyu-don/ Yoshinoya Consulted: November 3, 2026
  31. 秋の牛丼フェス2026(終了)— 通常価格と特別価格 www.yoshinoya.com/campaign/gyudon_fes_202610/ Yoshinoya Consulted: November 3, 2026
  32. 令和7年度 食生活・ライフスタイル調査 www.maff.go.jp/j/zyukyu/survey/attach/pdf/lifestyle-12.pdf Ministry of Agriculture, Forestry and Fisheries, Japan Consulted: November 3, 2026
  33. スーパーマーケット白書2026 — 消費者調査2025 www.super.or.jp/wp/wp-content/uploads/2026/03/NSAJ-Supermarket-hakusho2026.pdf National Supermarket Association of Japan Consulted: November 3, 2026
  34. 生活科学研究 No.52 — 2025年中食調査 www.nisshin-oillio.com/report/report/images/no52/no52.pdf Nisshin OilliO Consulted: November 3, 2026
  35. 令和7年度 食品廃棄物等の発生抑制及び再生利用の促進の取組に係る実態調査 報告書(令和8年3月) www.env.go.jp/recycle/foodloss/pdf/houkokusyo_r07.pdf Ministry of the Environment, Japan Consulted: November 3, 2026
  36. 2024年度の食品ロス量 — 消費者庁大臣発言要旨(2026年6月30日) www.caa.go.jp/notice/statement/kikawada2/046772.html Consumer Affairs Agency, Japan Consulted: November 3, 2026
  37. Hokkaido — Our Regional Cuisines www.maff.go.jp/e/policies/market/k_ryouri/search_menu/pref/hokkaido/index.html
  38. Kyoto — Our Regional Cuisines www.maff.go.jp/e/policies/market/k_ryouri/search_menu/pref/kyoto/index.html
  39. Okinawa — Area stories www.maff.go.jp/e/policies/market/k_ryouri/areastory/1494/index.html
  40. Okonomiyaki — Our Regional Cuisines www.maff.go.jp/e/policies/market/k_ryouri/search_menu/5798/index.html MAFF

We use session and security technologies to provide our features. Only with your permission do we load Google Analytics to measure visits and Google Maps on Contact. Choose separately, reject or accept both.

Withdraw either permission here. Withdrawing analytics reloads the page to unload the running tag.

Cookie policy